|
|
|
|
|
|
|
|
|
|
|
|
|
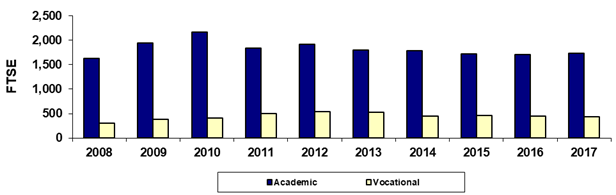
South Mountain Community College |
|
Fall 45th Day Academic/Vocational FTSE |
|
|
|
|
|
|
|
|
|
|
|
|
|
|
Year |
2008 |
2009 |
2010 |
2011 |
2012 |
2013 |
2014 |
2015 |
2016 |
2017 |
|
Academic |
1,622.4 |
1,949.4 |
2,169.7 |
1,838.9 |
1,919.6 |
1,801.9 |
1,788.8 |
1,723.3 |
1,706.9 |
1,729.0 |
|
Vocational |
301.9 |
380.3 |
408.5 |
499.5 |
535.1 |
533.3 |
452.0 |
464.7 |
442.3 |
437.7 |
|
Total |
1,924.3 |
2,329.7 |
2,578.2 |
2,338.5 |
2,454.7 |
2,335.3 |
2,240.8 |
2,188.1 |
2,149.2 |
2,166.7 |
|
|
|
|
|
|
|
|
|
|
|
|
|
% Academic |
84.3% |
83.7% |
84.2% |
78.6% |
78.2% |
77.2% |
79.8% |
78.8% |
79.4% |
79.8% |
|
% Vocational |
15.7% |
16.3% |
15.8% |
21.4% |
21.8% |
22.8% |
20.2% |
21.2% |
20.6% |
20.2% |
|
|
|
|
|
|
|
|
|
|
|
|
|
Due to rounding, the sum of the numbers may not
equal the Total. |
|
Print in landscape for best results |
Last updated on |
September 24, 2018 |
|
Source:
Offical 45th Day FTSE numbers as reported by the colleges after manual
adjustments (unaudited). |
|
Maricopa Community College District • Office of
Institutional Effectiveness • Maricopa Trends |
|
|
|
|
|
|
|
|
|
|
|
|