|
|
|
|
|
|
|
|
|
|
|
|
|
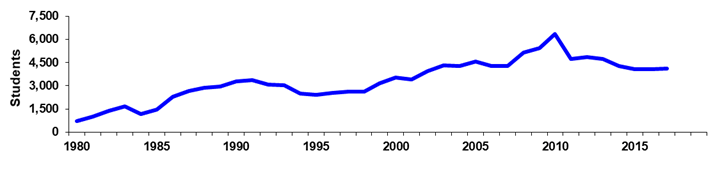
South Mountain Community College |
|
Fall 45th Day Historical Headcount |
|
|
|
|
|
|
|
|
|
|
|
|
|
|
|
|
|
|
|
|
|
|
|
|
|
Year |
1980 |
1981 |
1982 |
1983 |
1984 |
1985 |
1986 |
1987 |
1988 |
1989 |
|
Day |
252 |
504 |
680 |
892 |
729 |
903 |
1,407 |
1,947 |
1,871 |
1,864 |
|
% Change |
0.0% |
100.0% |
34.9% |
31.2% |
-18.3% |
23.9% |
55.8% |
38.4% |
-3.9% |
-0.4% |
|
Evening |
474 |
518 |
714 |
775 |
425 |
537 |
865 |
701 |
1,003 |
1,084 |
|
% Change |
0.0% |
9.3% |
37.8% |
8.5% |
-45.2% |
26.4% |
61.1% |
-19.0% |
43.1% |
8.1% |
|
Total |
726 |
1,022 |
1,394 |
1,667 |
1,154 |
1,440 |
2,272 |
2,648 |
2,874 |
2,948 |
|
% Change |
0.0% |
40.8% |
36.4% |
19.6% |
-30.8% |
24.8% |
57.8% |
16.5% |
8.5% |
2.6% |
|
|
|
|
|
|
|
|
|
|
|
|
|
Year |
1990 |
1991 |
1992 |
1993 |
1994 |
1995 |
1996 |
1997 |
1998 |
1999 |
|
Day |
1,992 |
1,953 |
2,154 |
2,032 |
1,625 |
1,448 |
1,486 |
1,551 |
1,463 |
1,925 |
|
% Change |
6.9% |
-2.0% |
10.3% |
-5.7% |
-20.0% |
-10.9% |
2.6% |
4.4% |
-5.7% |
31.6% |
|
Evening |
1,296 |
1,396 |
907 |
996 |
866 |
968 |
1,062 |
1,053 |
1,163 |
1,225 |
|
% Change |
19.6% |
7.7% |
-35.0% |
9.8% |
-13.1% |
11.8% |
9.7% |
-0.8% |
10.4% |
5.3% |
|
Total |
3,288 |
3,349 |
3,061 |
3,028 |
2,491 |
2,416 |
2,548 |
2,604 |
2,626 |
3,150 |
|
% Change |
11.5% |
1.9% |
-8.6% |
-1.1% |
-17.7% |
-3.0% |
5.5% |
2.2% |
0.8% |
20.0% |
|
|
|
|
|
|
|
|
|
|
|
|
|
Year |
2000 |
2001 |
2002 |
2003 |
2004 |
2005 |
2006 |
2007 |
2008 |
2009 |
|
Day |
2,036 |
1,803 |
2,046 |
2,289 |
2,192 |
2,397 |
2,443 |
2,176 |
0 |
0 |
|
% Change |
5.8% |
-11.4% |
13.5% |
11.9% |
-4.2% |
9.4% |
1.9% |
-10.9% |
0.0% |
0.0% |
|
Evening |
1,478 |
1,603 |
1,887 |
2,014 |
2,101 |
2,164 |
1,825 |
2,078 |
0 |
0 |
|
% Change |
20.7% |
8.5% |
17.7% |
6.7% |
4.3% |
3.0% |
-15.7% |
13.9% |
0.0% |
0.0% |
|
Total |
3,514 |
3,406 |
3,933 |
4,303 |
4,293 |
4,561 |
4,268 |
4,254 |
5,138 |
5,444 |
|
% Change |
11.6% |
-3.1% |
15.5% |
9.4% |
-0.2% |
6.2% |
-6.4% |
-0.3% |
20.8% |
6.0% |
|
|
|
|
|
|
|
|
|
|
|
|
|
Year |
2010 |
2011 |
2012 |
2013 |
2014 |
2015 |
2016 |
2017 |
|
|
|
Day |
0 |
|
|
|
|
|
|
|
|
|
|
% Change |
0.0% |
|
|
|
|
|
|
|
|
|
|
Evening |
0 |
|
|
|
|
|
|
|
|
|
|
% Change |
0.0% |
|
|
|
|
|
|
|
|
|
|
Total |
6,354 |
4,738 |
4,843 |
4,718 |
4,287 |
4,083 |
4,058 |
4,120 |
|
|
|
% Change |
16.7% |
-25.4% |
2.2% |
-2.6% |
-9.1% |
-4.8% |
-0.6% |
1.5% |
|
|
|
|
|
|
|
|
|
|
|
|
|
|
|
|
|
|
|
|
|
|
|
|
|
|
|
Print in landscape for
best results |
|
|
|
|
|
Last updated on |
September 24, 2018 |
|
Source:
Official 45th Day headcount as reported by colleges. |
|
Maricopa Community College District • Office of
Institutional Effectiveness • Maricopa Trends |
|
|
|
|
|
|
|
|
|
|
|
|