|
|
|
|
|
|
|
|
|
|
|
|
|
|
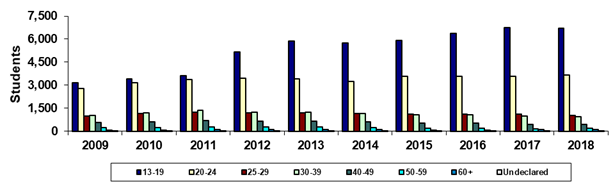
Chandler-Gilbert Community College |
|
|
Spring 45th Day Age Groups |
|
|
|
|
|
|
|
|
|
|
|
|
|
|
|
|
|
|
|
|
|
|
|
|
|
|
|
|
|
|
|
|
|
|
|
|
|
|
Year |
2009 |
2010 |
2011 |
2012 |
2013 |
2014 |
2015 |
2016 |
2017 |
2018 |
|
|
13-19 |
3,156 |
3,392 |
3,639 |
5,162 |
5,878 |
5,762 |
5,927 |
6,359 |
6,735 |
6,701 |
|
|
20-24 |
2,784 |
3,167 |
3,371 |
3,441 |
3,412 |
3,260 |
3,581 |
3,565 |
3,583 |
3,658 |
|
|
25-29 |
972 |
1,147 |
1,234 |
1,192 |
1,195 |
1,138 |
1,095 |
1,107 |
1,123 |
1,030 |
|
|
30-39 |
1,044 |
1,178 |
1,376 |
1,252 |
1,234 |
1,152 |
1,092 |
1,053 |
974 |
932 |
|
|
40-49 |
574 |
631 |
712 |
670 |
651 |
598 |
549 |
531 |
461 |
443 |
|
|
50-59 |
221 |
249 |
269 |
287 |
272 |
231 |
215 |
178 |
170 |
184 |
|
|
60+ |
69 |
75 |
95 |
98 |
111 |
101 |
69 |
83 |
99 |
122 |
|
|
Undeclared |
7 |
8 |
10 |
9 |
1 |
3 |
6 |
6 |
2 |
5 |
|
|
Total |
8,827 |
9,847 |
10,706 |
12,111 |
12,754 |
12,245 |
12,534 |
12,882 |
13,147 |
13,075 |
|
|
|
|
|
|
|
|
|
|
|
|
|
|
|
% 13-19 |
35.8% |
34.4% |
34.0% |
42.6% |
46.1% |
47.1% |
47.3% |
49.4% |
51.2% |
51.3% |
|
|
% 20-24 |
31.5% |
32.2% |
31.5% |
28.4% |
26.8% |
26.6% |
28.6% |
27.7% |
27.3% |
28.0% |
|
|
% 25-29 |
11.0% |
11.6% |
11.5% |
9.8% |
9.4% |
9.3% |
8.7% |
8.6% |
8.5% |
7.9% |
|
|
% 30-39 |
11.8% |
12.0% |
12.9% |
10.3% |
9.7% |
9.4% |
8.7% |
8.2% |
7.4% |
7.1% |
|
|
% 40-49 |
6.5% |
6.4% |
6.7% |
5.5% |
5.1% |
4.9% |
4.4% |
4.1% |
3.5% |
3.4% |
|
|
% 50-59 |
2.5% |
2.5% |
2.5% |
2.4% |
2.1% |
1.9% |
1.7% |
1.4% |
1.3% |
1.4% |
|
|
% 60+ |
0.8% |
0.8% |
0.9% |
0.8% |
0.9% |
0.8% |
0.6% |
0.6% |
0.8% |
0.9% |
|
|
% Undeclared |
0.1% |
0.1% |
0.1% |
0.1% |
0.0% |
0.0% |
0.0% |
0.0% |
0.0% |
0.0% |
|
|
|
|
|
|
|
|
|
|
|
|
|
|
|
Print in landscape for
best results |
|
|
|
|
|
Last updated on |
May 15, 2018 |
|
|
Source:
Official 45th Day headcount as reported by colleges. |
|
|
Maricopa Community College District • Office of
Institutional Effectiveness • Maricopa Trends |
|
|
https://asa.maricopa.edu/departments/institutional-effectiveness/data-and-projects/maricopa-trends |
|
|
|
|
|
|
|
|
|
|
|
|
|
|
|
|