|
|
|
|
|
|
|
|
|
|
|
|
|
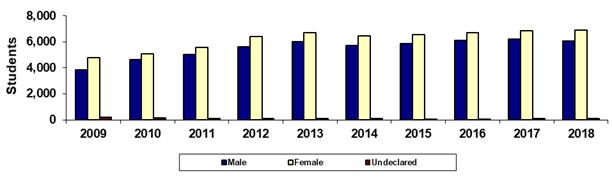
Chandler-Gilbert Community College |
|
Spring 45th Day Gender |
|
|
|
|
|
|
|
|
|
|
|
|
|
|
|
|
|
|
|
|
|
|
|
|
|
Year |
2009 |
2010 |
2011 |
2012 |
2013 |
2014 |
2015 |
2016 |
2017 |
2018 |
|
Male |
3,866 |
4,625 |
5,038 |
5,618 |
5,990 |
5,723 |
5,883 |
6,101 |
6,213 |
6,079 |
|
Female |
4,778 |
5,091 |
5,570 |
6,401 |
6,675 |
6,442 |
6,575 |
6,705 |
6,848 |
6,917 |
|
Undeclared |
183 |
131 |
98 |
92 |
89 |
80 |
76 |
76 |
86 |
79 |
|
Total |
8,827 |
9,847 |
10,706 |
12,111 |
12,754 |
12,245 |
12,534 |
12,882 |
13,147 |
13,075 |
|
|
|
% Male |
43.8% |
47.0% |
47.1% |
46.4% |
47.0% |
46.7% |
46.9% |
47.4% |
47.3% |
46.5% |
|
% Female |
54.1% |
51.7% |
52.0% |
52.9% |
52.3% |
52.6% |
52.5% |
52.0% |
52.1% |
52.9% |
|
% Undeclared |
2.1% |
1.3% |
0.9% |
0.8% |
0.7% |
0.7% |
0.6% |
0.6% |
0.7% |
0.6% |
|
|
|
|
|
|
|
|
|
|
|
|
|
Print in landscape for
best results |
|
|
|
|
|
Last updated on |
May 15, 2018 |
|
Source:
Official 45th Day headcount as reported by colleges. |
|
Maricopa Community College District • Office of
Institutional Effectiveness • Maricopa Trends |
|
https://asa.maricopa.edu/departments/institutional-effectiveness/data-and-projects/maricopa-trends |
|
|
|
|
|
|
|
|
|
|
|
|
|
|