|
|
|
|
|
|
|
|
|
|
|
|
|
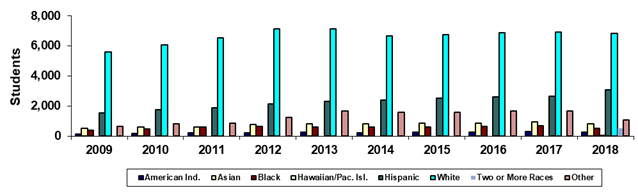
Chandler-Gilbert Community College |
|
Spring 45th Day Ethnicity |
|
|
|
|
|
|
|
|
|
|
|
|
|
|
Year |
2009 |
2010 |
2011 |
2012 |
2013 |
2014 |
2015 |
2016 |
2017 |
2018 |
|
American Ind. |
150 |
182 |
207 |
237 |
242 |
200 |
243 |
271 |
300 |
239 |
|
Asian |
535 |
579 |
598 |
757 |
811 |
816 |
875 |
869 |
945 |
805 |
|
Black |
389 |
484 |
618 |
625 |
609 |
592 |
602 |
624 |
682 |
506 |
|
Hawaiian/Pac. Isl. |
0 |
0 |
0 |
0 |
0 |
0 |
0 |
0 |
0 |
46 |
|
Hispanic |
1,537 |
1,735 |
1,879 |
2,132 |
2,295 |
2,410 |
2,519 |
2,591 |
2,651 |
3,074 |
|
White |
5,587 |
6,046 |
6,541 |
7,126 |
7,133 |
6,663 |
6,730 |
6,854 |
6,895 |
6,818 |
|
Two or More Races |
0 |
0 |
0 |
0 |
0 |
0 |
0 |
0 |
0 |
529 |
|
Other |
629 |
821 |
863 |
1,234 |
1,664 |
1,564 |
1,565 |
1,673 |
1,674 |
1,058 |
|
Total |
8,827 |
9,847 |
10,706 |
12,111 |
12,754 |
12,245 |
12,534 |
12,882 |
13,147 |
13,075 |
|
|
|
|
|
|
|
|
|
|
|
|
|
% American Ind. |
1.7% |
1.8% |
1.9% |
2.0% |
1.9% |
1.6% |
1.9% |
2.1% |
2.3% |
1.8% |
|
% Asian |
6.1% |
5.9% |
5.6% |
6.3% |
6.4% |
6.7% |
7.0% |
6.7% |
7.2% |
6.2% |
|
% Black |
4.4% |
4.9% |
5.8% |
5.2% |
4.8% |
4.8% |
4.8% |
4.8% |
5.2% |
3.9% |
|
% Hawaiian/Pac. Isl. |
0.0% |
0.0% |
0.0% |
0.0% |
0.0% |
0.0% |
0.0% |
0.0% |
0.0% |
0.4% |
|
% Hispanic |
17.4% |
17.6% |
17.6% |
17.6% |
18.0% |
19.7% |
20.1% |
20.1% |
20.2% |
23.5% |
|
% White |
63.3% |
61.4% |
61.1% |
58.8% |
55.9% |
54.4% |
53.7% |
53.2% |
52.4% |
52.1% |
|
% Two or More Races |
0.0% |
0.0% |
0.0% |
0.0% |
0.0% |
0.0% |
0.0% |
0.0% |
0.0% |
4.0% |
|
% Other |
7.1% |
8.3% |
8.1% |
10.2% |
13.0% |
12.8% |
12.5% |
13.0% |
12.7% |
8.1% |
|
|
|
|
|
|
|
|
|
|
|
|
|
Print in landscape for
best results |
|
|
|
|
|
Last updated on |
May 15, 2018 |
|
Source:
Official 45th Day headcount as reported by colleges. |
|
Maricopa Community College District • Office of
Institutional Effectiveness • Maricopa Trends |
|
https://asa.maricopa.edu/departments/institutional-effectiveness/data-and-projects/maricopa-trends |
|
|
|
|
*Beginning in Spring
2018, race-ethnicity categories changed to provide counts for
"Hawaiian/Pacific Islander" and "Two or more races." |
|
|
|
|
|
|
|
|
|
|
|
|