|
|
|
|
|
|
|
|
|
|
|
|
|
|
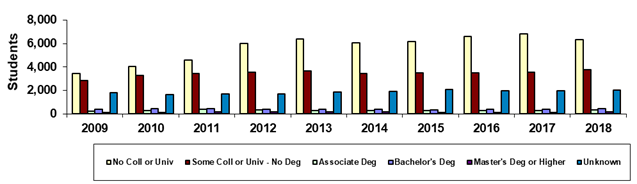
Chandler-Gilbert Community College |
|
|
Spring 45th Day Admission Status |
|
|
|
|
|
|
|
|
|
|
|
|
|
|
|
|
|
|
|
|
|
|
|
|
|
|
|
|
|
|
|
|
|
|
|
|
|
|
|
|
|
|
|
|
|
|
|
|
|
|
|
|
|
|
|
|
|
|
|
|
|
|
|
|
|
|
|
|
|
|
|
|
|
|
|
|
|
|
|
|
|
|
|
|
|
|
|
|
|
|
|
|
|
|
|
|
|
|
|
|
|
|
|
|
|
|
|
|
|
|
|
|
|
|
|
|
|
|
|
|
|
|
|
|
|
|
|
|
|
|
|
|
|
|
|
|
|
|
|
|
|
|
|
|
|
|
|
|
|
|
|
|
|
|
|
|
|
|
Year |
2009 |
2010 |
2011 |
2012 |
2013 |
2014 |
2015 |
2016 |
2017 |
2018 |
|
|
No Coll or Univ |
3,435 |
4,027 |
4,577 |
5,979 |
6,396 |
6,083 |
6,168 |
6,616 |
6,804 |
6,338 |
|
|
Some Coll or Univ - No Deg |
2,840 |
3,283 |
3,448 |
3,532 |
3,645 |
3,429 |
3,491 |
3,486 |
3,534 |
3,775 |
|
|
Associate Deg |
252 |
288 |
379 |
318 |
294 |
297 |
296 |
276 |
286 |
317 |
|
|
Bachelor's Deg |
377 |
452 |
461 |
395 |
417 |
387 |
359 |
387 |
398 |
434 |
|
|
Master's Deg or Higher |
111 |
142 |
152 |
169 |
159 |
155 |
144 |
144 |
137 |
186 |
|
|
Unknown |
1,812 |
1,655 |
1,689 |
1,718 |
1,843 |
1,894 |
2,076 |
1,973 |
1,988 |
2,025 |
|
|
Total |
8,827 |
9,847 |
10,706 |
12,111 |
12,754 |
12,245 |
12,534 |
12,882 |
13,147 |
13,075 |
|
|
|
|
|
|
|
|
|
|
|
|
|
|
|
|
|
|
|
|
|
|
|
|
|
|
|
|
% No Coll or Univ |
38.9% |
40.9% |
42.8% |
49.4% |
50.1% |
49.7% |
49.2% |
51.4% |
51.8% |
48.5% |
|
|
% Some Coll or Univ - No Deg |
32.2% |
33.3% |
32.2% |
29.2% |
28.6% |
28.0% |
27.9% |
27.1% |
26.9% |
28.9% |
|
|
% Associate Deg |
2.9% |
2.9% |
3.5% |
2.6% |
2.3% |
2.4% |
2.4% |
2.1% |
2.2% |
2.4% |
|
|
% Bachelor's Deg |
4.3% |
4.6% |
4.3% |
3.3% |
3.3% |
3.2% |
2.9% |
3.0% |
3.0% |
3.3% |
|
|
% Master's Deg or Higher |
1.3% |
1.4% |
1.4% |
1.4% |
1.2% |
1.3% |
1.1% |
1.1% |
1.0% |
1.4% |
|
|
% Unknown |
20.5% |
16.8% |
15.8% |
14.2% |
14.5% |
15.5% |
16.6% |
15.3% |
15.1% |
15.5% |
|
|
|
|
|
|
|
|
|
|
|
|
|
|
|
|
|
|
|
|
|
|
|
|
|
|
|
| |
Print in landscape for best results |
|
|
|
|
|
|
Last updated on |
May 15, 2018 |
|
| |
Source:
Official 45th Day headcount as reported by colleges. |
|
| |
Maricopa Community College District • Office of
Institutional Effectiveness • Maricopa Trends |
|
| |
https://asa.maricopa.edu/departments/institutional-effectiveness/data-and-projects/maricopa-trends |
|
|
|
|
|
|
|
|
|
|
|
|
|
|
|
|
|