|
|
|
|
|
|
|
|
|
|
|
|
|
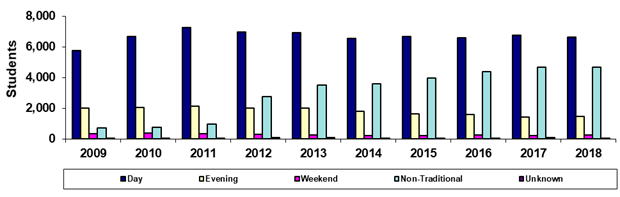
Chandler-Gilbert Community College |
|
Spring 45th Day Primary Time of Attendance
Headcount |
|
|
|
|
|
|
|
|
|
|
|
|
|
|
Year |
2009 |
2010 |
2011 |
2012 |
2013 |
2014 |
2015 |
2016 |
2017 |
2018 |
|
Day |
5,747 |
6,657 |
7,244 |
6,979 |
6,915 |
6,552 |
6,654 |
6,584 |
6,745 |
6,608 |
|
Evening |
2,018 |
2,048 |
2,150 |
1,992 |
1,994 |
1,812 |
1,635 |
1,590 |
1,443 |
1,484 |
|
Weekend |
328 |
375 |
353 |
283 |
271 |
233 |
231 |
244 |
203 |
238 |
|
Non-Traditional |
728 |
764 |
956 |
2,774 |
3,491 |
3,587 |
3,945 |
4,397 |
4,683 |
4,687 |
|
Unknown |
6 |
3 |
3 |
83 |
83 |
61 |
69 |
67 |
73 |
58 |
|
Total |
8,827 |
9,847 |
10,706 |
12,111 |
12,754 |
12,245 |
12,534 |
12,882 |
13,147 |
13,075 |
|
|
|
|
|
|
|
|
|
|
|
|
|
% Day |
65.1% |
67.6% |
67.7% |
57.6% |
54.2% |
53.5% |
53.1% |
51.1% |
51.3% |
50.5% |
|
% Evening |
22.9% |
20.8% |
20.1% |
16.4% |
15.6% |
14.8% |
13.0% |
12.3% |
11.0% |
11.3% |
|
%Weekend |
3.7% |
3.8% |
3.3% |
2.3% |
2.1% |
1.9% |
1.8% |
1.9% |
1.5% |
1.8% |
|
%Non-Traditional |
8.2% |
7.8% |
8.9% |
22.9% |
27.4% |
29.3% |
31.5% |
34.1% |
35.6% |
35.8% |
|
%Unknown |
0.1% |
0.0% |
0.0% |
0.7% |
0.7% |
0.5% |
0.6% |
0.5% |
0.6% |
0.4% |
|
|
|
|
|
|
|
|
|
|
|
|
| |
Print in landscape for
best results |
|
|
|
|
|
Last updated on |
May 15, 2018 |
| |
Source:
Official 45th Day headcount as reported by colleges. |
| |
Maricopa Community College District • Office of
Institutional Effectiveness • Maricopa Trends |
| |
https://asa.maricopa.edu/departments/institutional-effectiveness/data-and-projects/maricopa-trends |
|
|
|
|
|
|
|
|
|
|
|
|
|
|