|
|
|
|
|
|
|
|
|
|
|
|
|
|
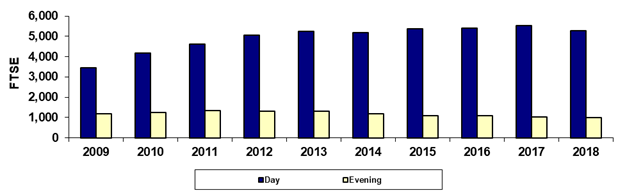
Chandler-Gilbert Community College |
|
|
Spring 45th Day Day/Evening FTSE |
|
|
|
|
|
|
|
|
|
|
|
|
|
|
|
|
|
|
|
|
|
|
|
|
|
|
|
|
|
|
|
|
|
|
|
|
|
|
|
|
|
|
|
|
|
|
|
|
|
|
|
|
|
|
|
|
|
|
|
|
|
|
|
|
|
|
|
|
|
|
|
|
|
|
|
|
|
|
|
|
|
|
|
|
|
|
|
|
|
|
|
|
|
|
|
|
|
|
|
|
|
|
|
|
|
|
|
|
|
|
|
|
|
|
|
|
|
|
|
|
|
|
|
|
|
|
|
|
|
|
|
|
|
|
|
|
|
|
|
|
|
|
|
|
|
|
|
|
|
|
|
|
|
|
|
|
|
|
Year |
2009 |
2010 |
2011 |
2012 |
2013 |
2014 |
2015 |
2016 |
2017 |
2018 |
|
|
Day |
3,448.3 |
4,162.4 |
4,600.2 |
5,057.4 |
5,242.4 |
5,180.2 |
5,354.8 |
5,395.1 |
5,539.8 |
5,280.7 |
|
|
Evening |
1,193.2 |
1,252.4 |
1,337.6 |
1,319.8 |
1,313.3 |
1,173.7 |
1,089.9 |
1,093.8 |
1,020.9 |
999.1 |
|
|
Total |
4,641.5 |
5,414.8 |
5,937.8 |
6,377.2 |
6,555.7 |
6,353.9 |
6,444.7 |
6,488.9 |
6,560.7 |
6,279.8 |
|
|
|
|
|
|
|
|
|
|
|
|
|
|
|
% Day |
74.3% |
76.9% |
77.5% |
79.3% |
80.0% |
81.5% |
83.1% |
83.1% |
84.4% |
84.1% |
|
|
% Evening |
25.7% |
23.1% |
22.5% |
20.7% |
20.0% |
18.5% |
16.9% |
16.9% |
15.6% |
15.9% |
|
|
|
|
|
|
|
|
|
|
|
|
|
|
|
Due to rounding, the sum
of the numbers may not equal the Total. |
|
|
Last updated on |
May 15, 2018 |
|
|
Print in landscape for best results |
|
|
|
|
Source:
Official 45th Day FTSE numbers as reported by the colleges after
manual adjustments (unaudited). |
|
|
Maricopa Community College District • Office of
Institutional Effectiveness • Maricopa Trends |
|
|
https://asa.maricopa.edu/departments/institutional-effectiveness/data-and-projects/maricopa-trends |
|
|
|
|
|
|
|
|
|
|
|
|
|
|
|
|