|
|
|
|
|
|
|
|
|
|
|
|
|
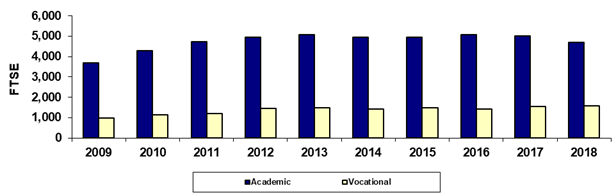
Chandler-Gilbert Community College |
|
Spring 45th Day Academic/Vocational FTSE |
|
|
|
|
|
|
|
|
|
|
|
|
|
|
Year |
2009 |
2010 |
2011 |
2012 |
2013 |
2014 |
2015 |
2016 |
2017 |
2018 |
|
Academic |
3,673.0 |
4,278.7 |
4,728.5 |
4,937.3 |
5,069.7 |
4,947.0 |
4,954.7 |
5,081.1 |
5,004.3 |
4,693.4 |
|
Vocational |
968.5 |
1,136.1 |
1,209.4 |
1,440.0 |
1,486.1 |
1,406.9 |
1,490.0 |
1,407.8 |
1,556.4 |
1,586.4 |
|
Total |
4,641.5 |
5,414.8 |
5,937.8 |
6,377.2 |
6,555.7 |
6,353.9 |
6,444.7 |
6,488.9 |
6,560.7 |
6,279.8 |
|
|
|
|
|
|
|
|
|
|
|
|
|
% Academic |
79.1% |
79.0% |
79.6% |
77.4% |
77.3% |
77.9% |
76.9% |
78.3% |
76.3% |
74.7% |
|
% Vocational |
20.9% |
21.0% |
20.4% |
22.6% |
22.7% |
22.1% |
23.1% |
21.7% |
23.7% |
25.3% |
|
|
|
|
|
|
|
|
|
|
|
|
|
Due to rounding, the sum
of the numbers may not equal the Total. |
|
|
Last updated on |
May 15, 2018 |
|
Print in landscape for best results |
|
|
|
Source:
Official 45th Day FTSE numbers as reported by the colleges after
manual adjustments (unaudited). |
|
Maricopa Community College District • Office of
Institutional Effectiveness • Maricopa Trends |
|
https://asa.maricopa.edu/departments/institutional-effectiveness/data-and-projects/maricopa-trends |
|
|
|
|
|
|
|
|
|
|
|
|
|
|