|
|
|
|
|
|
|
|
|
|
|
|
|
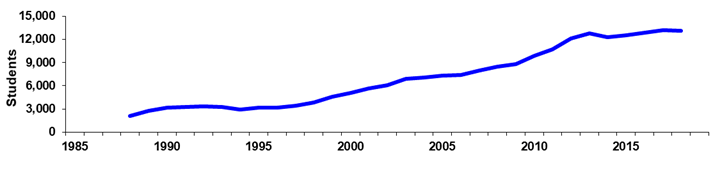
Chandler-Gilbert Community College |
|
Spring 45th Day Historical Headcount |
|
|
|
|
|
|
|
|
|
|
|
|
|
|
|
|
|
|
|
|
|
|
|
|
|
Year |
1980 |
1981 |
1982 |
1983 |
1984 |
1985 |
1986 |
1987 |
1988 |
1989 |
|
Day |
|
|
|
|
|
|
|
|
962 |
1,152 |
|
% Change |
|
|
|
|
|
|
|
|
0.0% |
19.8% |
|
Evening |
|
|
|
|
|
|
|
|
1,152 |
1,629 |
|
% Change |
|
|
|
|
|
|
|
|
0.0% |
41.4% |
|
Total |
|
|
|
|
|
|
|
|
2,114 |
2,781 |
|
% Change |
|
|
|
|
|
|
|
|
0.0% |
31.6% |
|
|
|
|
|
|
|
|
|
|
|
|
|
Year |
1990 |
1991 |
1992 |
1993 |
1994 |
1995 |
1996 |
1997 |
1998 |
1999 |
|
Day |
1,438 |
1,684 |
1,781 |
1,846 |
1,572 |
1,756 |
1,742 |
1,920 |
2,300 |
2,808 |
|
% Change |
24.8% |
17.1% |
5.8% |
3.6% |
-14.8% |
11.7% |
-0.8% |
10.2% |
19.8% |
22.1% |
|
Evening |
1,740 |
1,601 |
1,582 |
1,370 |
1,333 |
1,374 |
1,429 |
1,488 |
1,544 |
1,741 |
|
% Change |
6.8% |
-8.0% |
-1.2% |
-13.4% |
-2.7% |
3.1% |
4.0% |
4.1% |
3.8% |
12.8% |
|
Total |
3,178 |
3,285 |
3,363 |
3,216 |
2,905 |
3,130 |
3,171 |
3,408 |
3,844 |
4,549 |
|
% Change |
14.3% |
3.4% |
2.4% |
-4.4% |
-9.7% |
7.7% |
1.3% |
7.5% |
12.8% |
18.3% |
|
|
|
|
|
|
|
|
|
|
|
|
|
Year |
2000 |
2001 |
2002 |
2003 |
2004 |
2005 |
2006 |
2007 |
2008 |
2009 |
|
Day |
3,044 |
3,305 |
3,514 |
4,224 |
4,385 |
4,609 |
4,823 |
5,393 |
0 |
0 |
|
% Change |
8.4% |
8.6% |
6.3% |
20.2% |
3.8% |
5.1% |
4.6% |
11.8% |
-100.0% |
#DIV/0! |
|
Evening |
1,989 |
2,355 |
2,589 |
2,702 |
2,658 |
2,662 |
2,534 |
2,610 |
0 |
0 |
|
% Change |
14.2% |
18.4% |
9.9% |
4.4% |
-1.6% |
0.2% |
-4.8% |
3.0% |
-100.0% |
#DIV/0! |
|
Total |
5,033 |
5,660 |
6,103 |
6,926 |
7,043 |
7,271 |
7,357 |
8,003 |
8,461 |
8,827 |
|
% Change |
10.6% |
12.5% |
7.8% |
13.5% |
1.7% |
3.2% |
1.2% |
8.8% |
5.7% |
4.3% |
|
|
|
|
|
|
|
|
|
|
|
|
|
Year |
2010 |
2011 |
2012 |
2013 |
2014 |
2015 |
2016 |
2017 |
2018 |
|
|
Day |
0 |
|
|
|
|
|
|
|
|
|
|
% Change |
0.0% |
|
|
|
|
|
|
|
|
|
|
Evening |
0 |
|
|
|
|
|
|
|
|
|
|
% Change |
0.0% |
|
|
|
|
|
|
|
|
|
|
Total |
9,847 |
10,706 |
12,111 |
12,754 |
12,245 |
12,534 |
12,882 |
13,147 |
13,075 |
|
|
% Change |
11.6% |
8.7% |
13.1% |
5.3% |
-4.0% |
2.4% |
2.8% |
2.1% |
-0.5% |
|
|
|
|
|
|
|
|
|
|
|
|
|
|
|
|
|
|
|
|
|
|
|
|
|
| |
Print in landscape for
best results |
|
|
|
|
|
Last updated on |
May 15, 2018 |
| |
Source:
Official 45th Day headcount as reported by colleges. |
| |
Maricopa Community College District • Office of
Institutional Effectiveness • Maricopa Trends |
| |
https://asa.maricopa.edu/departments/institutional-effectiveness/data-and-projects/maricopa-trends |
|
|
|
|
|
|
|
|
|
|
|
|
|
|
|
|