|
|
|
|
|
|
|
|
|
|
|
|
|
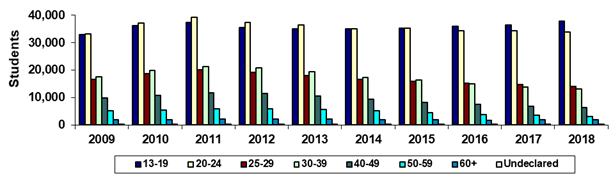
Maricopa County Community College District |
|
Spring 45th Day Age Groups |
|
Sum of College (Duplicated) Headcount Totals |
|
|
(Students enrolled at more than one college in the
term are counted in the total more than once) |
|
|
|
|
|
|
|
|
|
|
|
|
|
Year |
2009 |
2010 |
2011 |
2012 |
2013 |
2014 |
2015 |
2016 |
2017 |
2018 |
|
13-19 |
32,978 |
36,132 |
37,239 |
35,355 |
35,037 |
35,002 |
35,308 |
36,026 |
36,350 |
37,753 |
|
20-24 |
33,145 |
37,145 |
39,093 |
37,361 |
36,491 |
35,008 |
35,153 |
34,419 |
34,245 |
33,882 |
|
25-29 |
16,684 |
18,802 |
20,184 |
19,157 |
17,938 |
16,636 |
15,973 |
15,294 |
14,801 |
14,129 |
|
30-39 |
17,534 |
19,854 |
21,379 |
20,794 |
19,399 |
17,413 |
16,362 |
14,968 |
13,807 |
13,037 |
|
40-49 |
9,862 |
10,776 |
11,744 |
11,518 |
10,635 |
9,340 |
8,334 |
7,617 |
6,729 |
6,406 |
|
50-59 |
5,235 |
5,449 |
5,915 |
5,827 |
5,665 |
5,180 |
4,438 |
3,865 |
3,501 |
3,219 |
|
60+ |
1,947 |
1,872 |
2,105 |
2,100 |
2,086 |
2,073 |
1,861 |
1,799 |
1,874 |
1,847 |
|
Undeclared |
203 |
142 |
104 |
66 |
52 |
49 |
49 |
41 |
40 |
32 |
|
Sum of Colleges* |
117,588 |
130,172 |
137,763 |
132,178 |
127,303 |
120,701 |
117,478 |
114,029 |
111,347 |
110,305 |
|
|
|
|
|
|
|
|
|
|
|
|
|
% 13-19 |
28.0% |
27.8% |
27.0% |
26.7% |
27.5% |
29.0% |
30.1% |
31.6% |
32.6% |
34.2% |
|
% 20-24 |
28.2% |
28.5% |
28.4% |
28.3% |
28.7% |
29.0% |
29.9% |
30.2% |
30.8% |
30.7% |
|
% 25-29 |
14.2% |
14.4% |
14.7% |
14.5% |
14.1% |
13.8% |
13.6% |
13.4% |
13.3% |
12.8% |
|
% 30-39 |
14.9% |
15.3% |
15.5% |
15.7% |
15.2% |
14.4% |
13.9% |
13.1% |
12.4% |
11.8% |
|
% 40-49 |
8.4% |
8.3% |
8.5% |
8.7% |
8.4% |
7.7% |
7.1% |
6.7% |
6.0% |
5.8% |
|
% 50-59 |
4.5% |
4.2% |
4.3% |
4.4% |
4.5% |
4.3% |
3.8% |
3.4% |
3.1% |
2.9% |
|
% 60+ |
1.7% |
1.4% |
1.5% |
1.6% |
1.6% |
1.7% |
1.6% |
1.6% |
1.7% |
1.7% |
|
% Undeclared |
0.2% |
0.1% |
0.1% |
0.0% |
0.0% |
0.0% |
0.0% |
0.0% |
0.0% |
0.0% |
|
|
|
|
|
|
|
|
|
|
|
|
|
Print in landscape for best results |
Last updated on |
May 15, 2018 |
|
*Sum of Colleges:
Each student was counted only once at each college the student
attended, but students who were |
|
enrolled in more than one college were counted
more than once in the Sum of Colleges. |
|
Note: A timing difference in data capture for
Spring 2015 resulted in 20 fewer students in this report than the official
number reported to |
|
the State. |
|
|
|
|
|
|
|
|
|
|
|
Source:
Official 45th Day headcount as reported by colleges. |
|
Maricopa Community College District • Office of
Institutional Effectiveness • Maricopa Trends |
|
https://asa.maricopa.edu/departments/institutional-effectiveness/data-and-projects/maricopa-trends |
|
|
|
|
|
|
|
|
|
|
|
|
|
|
|
|
|
|
|
|
|
|
|
|
|
|
|
Spring 45th Day Age Groups |
|
District-wide Unduplicated Total |
|
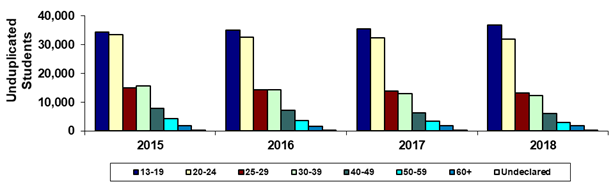
| (Each student is counted only once) |
|
|
|
|
|
|
|
|
|
|
|
|
|
|
|
|
|
|
|
|
|
|
|
|
|
|
|
|
|
|
|
|
|
|
|
|
|
|
|
|
|
|
|
|
|
|
|
|
|
|
|
|
|
|
|
|
|
|
|
|
|
|
|
|
|
|
|
|
|
|
|
|
|
|
|
|
|
|
|
|
|
|
|
|
|
|
|
|
|
|
|
|
|
|
|
|
|
|
|
|
|
|
|
|
|
|
|
|
|
|
|
|
|
|
|
|
|
|
|
|
|
|
|
|
|
|
|
|
|
|
|
|
|
|
Year |
2015 |
2016 |
2017 |
2018 |
|
|
|
|
|
|
|
13-19 |
34,374 |
35,133 |
35,456 |
36,740 |
|
|
|
|
|
|
|
20-24 |
33,380 |
32,563 |
32,317 |
31,913 |
|
|
|
|
|
|
|
25-29 |
15,121 |
14,399 |
13,955 |
13,274 |
|
|
|
|
|
|
|
30-39 |
15,598 |
14,235 |
13,097 |
12,299 |
|
|
|
|
|
|
|
40-49 |
7,976 |
7,278 |
6,420 |
6,118 |
|
|
|
|
|
|
|
50-59 |
4,286 |
3,750 |
3,367 |
3,102 |
|
|
|
|
|
|
|
60+ |
1,811 |
1,753 |
1,832 |
1,796 |
|
|
|
|
|
|
|
Undeclared |
44 |
36 |
39 |
28 |
|
|
|
|
|
|
|
Unduplicated Total |
112,590 |
109,147 |
106,483 |
105,270 |
|
|
|
|
|
|
|
|
|
|
|
|
|
|
|
|
|
|
|
% 13-19 |
30.5% |
32.2% |
33.3% |
34.9% |
|
|
|
|
|
|
|
% 20-24 |
29.6% |
29.8% |
30.3% |
30.3% |
|
|
|
|
|
|
|
% 25-29 |
13.4% |
13.2% |
13.1% |
12.6% |
|
|
|
|
|
|
|
% 30-39 |
13.9% |
13.0% |
12.3% |
11.7% |
|
|
|
|
|
|
|
% 40-49 |
7.1% |
6.7% |
6.0% |
5.8% |
|
|
|
|
|
|
|
% 50-59 |
3.8% |
3.4% |
3.2% |
2.9% |
|
|
|
|
|
|
|
% 60+ |
1.6% |
1.6% |
1.7% |
1.7% |
|
|
|
|
|
|
|
% Undeclared |
0.0% |
0.0% |
0.0% |
0.0% |
|
|
|
|
|
|
|
|
|
|
|
|
|
|
|
|
|
|
|
Print in landscape for best results |
Last updated on |
May 15, 2018 |
|
Unduplicated Total: Each student was counted only once in the
system-wide total. |
|
Maricopa Community College District • Office of
Institutional Effectiveness • Maricopa Trends |
|
https://asa.maricopa.edu/departments/institutional-effectiveness/data-and-projects/maricopa-trends |
|
|
|
|
|
|
|
|
|
|
|
|
|
|