|
|
|
|
|
|
|
|
|
|
|
|
|
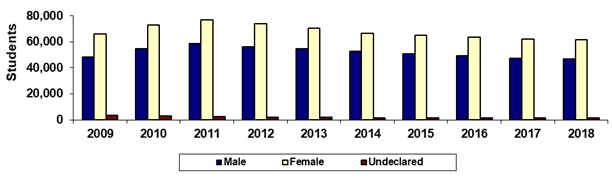
Maricopa County Community College District |
|
Spring 45th Day Gender |
|
|
|
|
|
|
|
|
|
|
|
|
|
|
|
|
|
|
|
|
|
|
|
|
|
Year |
2009 |
2010 |
2011 |
2012 |
2013 |
2014 |
2015 |
2016 |
2017 |
2018 |
|
Male |
48,262 |
54,493 |
58,406 |
56,219 |
54,785 |
52,611 |
50,983 |
49,148 |
47,472 |
46,926 |
|
Female |
65,852 |
72,853 |
76,798 |
73,845 |
70,588 |
66,456 |
64,996 |
63,386 |
62,224 |
61,725 |
|
Undeclared |
3,474 |
2,826 |
2,559 |
2,114 |
1,930 |
1,634 |
1,499 |
1,495 |
1,651 |
1,654 |
|
Sum of Colleges* |
117,588 |
130,172 |
137,763 |
132,178 |
127,303 |
120,701 |
117,478 |
114,029 |
111,347 |
110,305 |
|
|
|
% Male |
41.0% |
41.9% |
42.4% |
42.5% |
43.0% |
43.6% |
43.4% |
43.1% |
42.6% |
42.5% |
|
% Female |
56.0% |
56.0% |
55.7% |
55.9% |
55.4% |
55.1% |
55.3% |
55.6% |
55.9% |
56.0% |
|
% Undeclared |
3.0% |
2.2% |
1.9% |
1.6% |
1.5% |
1.4% |
1.3% |
1.3% |
1.5% |
1.5% |
|
|
|
|
|
|
|
|
|
|
|
|
|
Print in landscape for best results |
Last updated on |
May 15, 2018 |
|
*Sum of Colleges:
Each student was counted only once at each college the student
attended, but students who were |
|
enrolled in more than one college were counted
more than once in the Sum of Colleges. |
|
Note: A timing difference in data capture for
Spring 2015 resulted in 20 fewer students in this report than the official
number reported to |
|
the State. |
|
|
|
|
|
|
|
|
|
|
|
Source:
Official 45th Day headcount as reported by colleges. |
|
Maricopa Community College District • Office of
Institutional Effectiveness • Maricopa Trends |
|
https://asa.maricopa.edu/departments/institutional-effectiveness/data-and-projects/maricopa-trends |
|
|
|
|
|
|
|
|
|
|
|
|
|
|
|
|
|
|
|
|
|
|
|
|
|
|
|
|
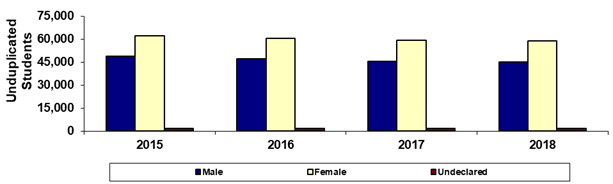
Maricopa County Community College District |
|
Spring 45th Day Gender |
|
District-wide Unduplicated Total |
|
(Each student is counted only once) |
|
|
|
|
|
|
|
|
|
|
|
|
|
 |
|
|
|
|
|
|
|
|
|
|
|
|
|
|
|
|
|
|
|
|
|
|
|
|
|
|
|
|
|
|
|
|
|
|
|
|
|
|
|
|
|
|
|
|
|
|
|
|
|
|
|
|
|
|
|
|
|
|
|
|
|
|
|
|
|
|
|
|
|
|
|
|
|
|
|
|
|
|
|
|
|
|
|
|
|
|
|
|
|
|
|
|
|
|
|
|
|
|
|
|
|
|
|
|
|
|
|
|
|
|
|
|
|
|
|
|
|
|
|
|
|
|
|
|
|
|
|
|
|
|
|
|
|
|
|
|
|
|
|
|
|
|
|
Year |
2015 |
2016 |
2017 |
2018 |
|
|
|
|
|
|
|
Male |
48,934 |
47,177 |
45,452 |
44,908 |
|
|
|
|
|
|
|
Female |
62,178 |
60,505 |
59,418 |
58,765 |
|
|
|
|
|
|
|
Undeclared |
1,478 |
1,465 |
1,613 |
1,597 |
|
|
|
|
|
|
|
Unduplicated Total |
112,590 |
109,147 |
106,483 |
105,270 |
|
|
|
|
|
|
|
|
|
|
|
|
|
|
|
|
|
|
|
%Male |
43.5% |
43.2% |
42.7% |
42.7% |
|
|
|
|
|
|
|
%Female |
55.2% |
55.4% |
55.8% |
55.8% |
|
|
|
|
|
|
|
%Undeclared |
1.3% |
1.3% |
1.5% |
1.5% |
|
|
|
|
|
|
|
|
|
|
|
|
|
|
|
|
|
|
|
Print in landscape for best results |
Last updated on |
May 15, 2018 |
|
Unduplicated Total: Each student was counted only once in the
system-wide total. |
|
Maricopa Community College District • Office of
Institutional Effectiveness • Maricopa Trends |
|
https://asa.maricopa.edu/departments/institutional-effectiveness/data-and-projects/maricopa-trends |
|
|
|
|
|
|
|
|
|
|
|
|
|
|
|