|
|
|
|
|
|
|
|
|
|
|
|
|
Maricopa County Community College District |
|
Spring 45th Day Ethnicity |
|
|
|
|
|
|
|
|
|
|
|
|
|
|
Year |
2009 |
2010 |
2011 |
2012 |
2013 |
2014 |
2015 |
2016 |
2017 |
2018 |
|
American Ind. |
3,125 |
3,618 |
4,156 |
4,059 |
3,806 |
3,548 |
3,433 |
3,324 |
3,310 |
2,630 |
|
Asian |
5,267 |
5,692 |
6,322 |
6,066 |
5,953 |
6,139 |
6,081 |
5,984 |
6,165 |
4,961 |
|
Black |
7,610 |
9,775 |
11,749 |
12,116 |
11,252 |
10,008 |
9,320 |
8,874 |
8,768 |
7,092 |
|
Hawaiian/Pac. Isl. |
0 |
0 |
0 |
0 |
0 |
0 |
0 |
0 |
0 |
311 |
|
Hispanic |
22,636 |
26,044 |
29,026 |
28,865 |
29,585 |
30,163 |
30,898 |
31,388 |
32,043 |
35,929 |
|
White |
68,080 |
72,101 |
75,559 |
70,168 |
65,360 |
60,392 |
56,970 |
53,813 |
50,948 |
48,505 |
|
Two or More Races |
0 |
0 |
0 |
0 |
0 |
0 |
0 |
0 |
0 |
3,371 |
|
Other |
10,870 |
12,942 |
10,951 |
10,904 |
11,347 |
10,451 |
10,776 |
10,646 |
10,113 |
7,506 |
|
Sum of Colleges* |
117,588 |
130,172 |
137,763 |
132,178 |
127,303 |
120,701 |
117,478 |
114,029 |
111,347 |
110,305 |
|
|
|
|
|
|
|
|
|
|
|
|
|
% American Ind. |
2.7% |
2.8% |
3.0% |
3.1% |
3.0% |
2.9% |
2.9% |
2.9% |
3.0% |
2.4% |
|
% Asian |
4.5% |
4.4% |
4.6% |
4.6% |
4.7% |
5.1% |
5.2% |
5.2% |
5.5% |
4.5% |
|
% Black |
6.5% |
7.5% |
8.5% |
9.2% |
8.8% |
8.3% |
7.9% |
7.8% |
7.9% |
6.4% |
|
% Hawaiian/Pac. Isl. |
0.0% |
0.0% |
0.0% |
0.0% |
0.0% |
0.0% |
0.0% |
0.0% |
0.0% |
0.3% |
|
% Hispanic |
19.3% |
20.0% |
21.1% |
21.8% |
23.2% |
25.0% |
26.3% |
27.5% |
28.8% |
32.6% |
|
% White |
57.9% |
55.4% |
54.8% |
53.1% |
51.3% |
50.0% |
48.5% |
47.2% |
45.8% |
44.0% |
|
% Two or More Races |
0.0% |
0.0% |
0.0% |
0.0% |
0.0% |
0.0% |
0.0% |
0.0% |
0.0% |
3.1% |
|
% Other |
9.2% |
9.9% |
7.9% |
8.2% |
8.9% |
8.7% |
9.2% |
9.3% |
9.1% |
6.8% |
|
|
|
|
|
|
|
|
|
|
|
|
|
Print in landscape for best results |
Last updated on |
May 15, 2018 |
|
*Sum of Colleges:
Each student was counted only once at each college the student
attended, but students who were |
|
enrolled in more than one college were counted
more than once in the Sum of Colleges. |
|
Note: A timing difference in data capture for
Spring 2015 resulted in 20 fewer students in this report than the official
number reported to |
|
the State. |
|
|
|
|
|
|
|
|
|
|
|
Source:
Official 45th Day headcount as reported by colleges. |
|
Maricopa Community College District • Office of
Institutional Effectiveness • Maricopa Trends |
|
https://asa.maricopa.edu/departments/institutional-effectiveness/data-and-projects/maricopa-trends |
|
|
|
|
*Beginning in Spring
2018, race-ethnicity categories changed to provide counts for
"Hawaiian/Pacific Islander" and "Two or more races." |
|
|
|
|
|
|
|
|
|
|
|
|
|
|
|
|
|
|
|
|
|
|
|
|
|
Maricopa County Community College District |
|
Spring 45th Day Ethnicity |
|
| District-wide Unduplicated Total |
|
|
(Each student is counted only once) |
|
|
|
|
|
|
|
|
|
|
|
|
|
|
|
|
|
|
|
|
|
|
|
|
|
|
|
|
|
|
|
|
|
|
|
|
|
|
|
|
|
|
|
|
|
|
|
|
|
|
0 |
|
|
|
|
|
|
|
|
|
|
|
|
|
|
|
|
|
|
|
|
|
|
|
|
|
|
|
|
|
|
|
|
|
|
|
|
|
|
|
|
|
|
|
|
|
|
|
|
|
|
|
|
|
|
|
|
|
|
|
|
|
|
|
|
|
|
|
|
|
|
|
|
|
|
|
|
|
|
|
|
|
|
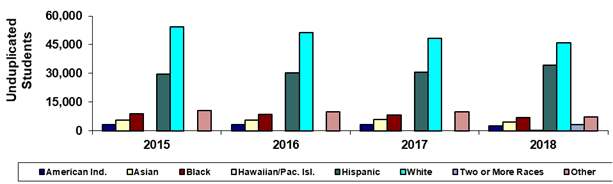
Year |
2015 |
2016 |
2017 |
2018 |
|
|
|
|
|
|
|
American Ind. |
3,307 |
3,228 |
3,188 |
2,537 |
|
|
|
|
|
|
|
Asian |
5,755 |
5,725 |
5,874 |
4,745 |
|
|
|
|
|
|
|
Black |
8,953 |
8,560 |
8,397 |
6,807 |
|
|
|
|
|
|
|
Hawaiian/Pac. Isl. |
0 |
0 |
0 |
292 |
|
|
|
|
|
|
|
Hispanic |
29,679 |
30,185 |
30,643 |
34,270 |
|
|
|
|
|
|
|
White |
54,371 |
51,378 |
48,488 |
46,075 |
|
|
|
|
|
|
|
Two or More Races |
0 |
0 |
0 |
3,189 |
|
|
|
|
|
|
|
Other |
10,525 |
10,071 |
9,893 |
7,355 |
|
|
|
|
|
|
|
Unduplicated Total |
112,590 |
109,147 |
106,483 |
105,270 |
|
|
|
|
|
|
|
|
|
|
|
|
|
|
|
|
|
|
|
% American Ind. |
2.9% |
3.0% |
3.0% |
2.4% |
|
|
|
|
|
|
|
% Asian |
5.1% |
5.2% |
5.5% |
4.5% |
|
|
|
|
|
|
|
% Black |
8.0% |
7.8% |
7.9% |
6.5% |
|
|
|
|
|
|
|
%Hawaiian/Pac. Isl. |
0.0% |
0.0% |
0.0% |
0.3% |
|
|
|
|
|
|
|
% Hispanic |
26.4% |
27.7% |
28.8% |
32.6% |
|
|
|
|
|
|
|
% White |
48.3% |
47.1% |
45.5% |
43.8% |
|
|
|
|
|
|
|
% Two or More Races |
0.0% |
0.0% |
0.0% |
3.0% |
|
|
|
|
|
|
|
% Other |
9.3% |
9.2% |
9.3% |
7.0% |
|
|
|
|
|
|
|
|
|
|
|
|
|
|
|
|
|
|
|
Print in landscape for best results |
Last updated on |
May 15, 2018 |
|
Unduplicated Total: Each student was counted only once in the
system-wide total. |
|
Maricopa Community College District • Office of
Institutional Effectiveness • Maricopa Trends |
|
https://asa.maricopa.edu/departments/institutional-effectiveness/data-and-projects/maricopa-trends |
|
|
|
|
*Beginning in Spring
2018, race-ethnicity categories changed to provide counts for
"Hawaiian/Pacific Islander" and "Two or more races." |
|
|
|
|
|
|
|
|
|
|
|
|
