|
|
|
|
|
|
|
|
|
|
|
|
|
|
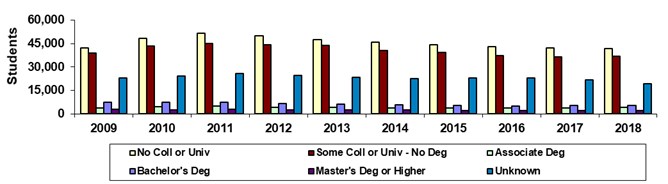
Maricopa County Community College District |
|
|
Spring 45th Day Admission Status |
|
|
|
|
|
|
|
|
|
|
|
|
|
|
|
|
|
|
|
|
|
|
|
|
|
|
|
|
|
|
|
|
|
|
|
|
|
|
|
|
|
|
|
|
|
|
|
|
|
|
|
|
|
|
|
|
|
|
|
|
|
|
|
|
|
|
|
|
|
|
|
|
|
|
|
|
|
|
|
|
|
|
|
|
|
|
|
|
|
|
|
|
|
|
|
|
|
|
|
|
|
|
|
|
|
|
|
|
|
|
|
|
|
|
|
|
|
|
|
|
|
|
|
|
|
|
|
|
|
|
|
|
|
|
|
|
|
|
|
|
|
|
|
|
|
|
|
|
|
|
|
|
|
|
|
|
|
|
Year |
2009 |
2010 |
2011 |
2012 |
2013 |
2014 |
2015 |
2016 |
2017 |
2018 |
|
|
No Coll or Univ |
42,153 |
48,229 |
51,542 |
50,005 |
47,506 |
45,879 |
44,358 |
42,819 |
42,087 |
41,786 |
|
|
Some Coll or Univ - No Deg |
38,732 |
43,219 |
45,104 |
44,143 |
43,681 |
40,603 |
39,243 |
37,451 |
36,347 |
37,019 |
|
|
Associate Deg |
3,727 |
4,394 |
4,993 |
4,155 |
4,018 |
3,688 |
3,619 |
3,561 |
3,739 |
4,249 |
|
|
Bachelor's Deg |
7,264 |
7,454 |
7,369 |
6,615 |
6,295 |
5,650 |
5,264 |
5,104 |
5,373 |
5,587 |
|
|
Master's Deg or Higher |
2,811 |
2,684 |
2,874 |
2,682 |
2,477 |
2,395 |
2,219 |
2,043 |
2,189 |
2,296 |
|
|
Unknown |
22,901 |
24,192 |
25,881 |
24,578 |
23,326 |
22,486 |
22,775 |
23,051 |
21,612 |
19,368 |
|
|
Sum of Colleges* |
117,588 |
130,172 |
137,763 |
132,178 |
127,303 |
120,701 |
117,478 |
114,029 |
111,347 |
110,305 |
|
|
|
|
|
|
|
|
|
|
|
|
|
|
|
|
|
|
|
|
|
|
|
|
|
|
|
|
% No Coll or Univ |
35.8% |
37.1% |
37.4% |
37.8% |
37.3% |
38.0% |
37.8% |
37.6% |
37.8% |
37.9% |
|
|
% Some Coll or Univ - No Deg |
32.9% |
33.2% |
32.7% |
33.4% |
34.3% |
33.6% |
33.4% |
32.8% |
32.6% |
33.6% |
|
|
% Associate Deg |
3.2% |
3.4% |
3.6% |
3.1% |
3.2% |
3.1% |
3.1% |
3.1% |
3.4% |
3.9% |
|
|
% Bachelor's Deg |
6.2% |
5.7% |
5.3% |
5.0% |
4.9% |
4.7% |
4.5% |
4.5% |
4.8% |
5.1% |
|
|
% Master's Deg or Higher |
2.4% |
2.1% |
2.1% |
2.0% |
1.9% |
2.0% |
1.9% |
1.8% |
2.0% |
2.1% |
|
|
% Unknown |
19.5% |
18.6% |
18.8% |
18.6% |
18.3% |
18.6% |
19.4% |
20.2% |
19.4% |
17.6% |
|
|
|
|
|
|
|
|
|
|
|
|
|
|
|
|
|
|
|
|
|
|
|
|
|
|
|
| |
Print in landscape for best results |
Last updated on |
May 15, 2018 |
|
| |
*Sum of Colleges:
Each student was counted only once at each college the student
attended, but students who were |
|
| |
enrolled in more than one college were counted
more than once in the Sum of Colleges. |
|
| |
Note: A timing difference in data capture for
Spring 2015 resulted in 20 fewer students in this report than the official
number reported to |
|
| |
the State. |
|
|
|
|
|
|
|
|
|
|
|
| |
Source:
Official 45th Day headcount as reported by colleges. |
|
| |
Maricopa Community College District • Office of
Institutional Effectiveness • Maricopa Trends |
|
| |
https://asa.maricopa.edu/departments/institutional-effectiveness/data-and-projects/maricopa-trends |
|
|
|
|
|
|
|
|
|
|
|
|
|
|
|
|
|
|
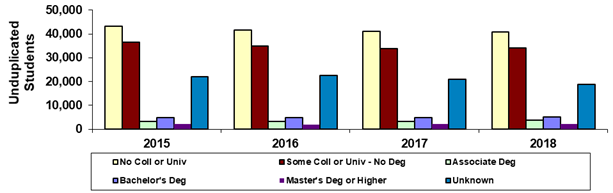
Maricopa County Community College District |
|
|
Spring 45th Day Admission Status |
|
|
District-wide Unduplicated Total |
|
|
(Each student is counted only once) |
|
|
 |
|
|
|
|
|
|
|
|
|
|
|
|
|
|
|
|
|
|
|
|
|
|
|
|
|
|
|
|
|
|
|
|
|
|
|
|
|
|
|
|
|
|
|
|
|
|
|
|
|
|
|
|
|
|
|
|
|
|
|
|
|
|
|
|
|
|
|
|
|
|
|
|
|
|
|
|
|
|
|
|
|
|
|
|
|
|
|
|
|
|
|
|
|
|
|
|
|
|
|
|
|
|
|
|
|
|
|
|
|
|
|
|
|
|
|
|
|
|
|
|
|
|
|
|
|
|
|
|
|
|
|
|
|
|
|
|
|
|
|
|
|
|
|
|
|
|
|
|
|
|
|
|
|
|
|
|
|
|
|
|
|
|
|
|
|
|
|
|
Year |
2015 |
2016 |
2017 |
2018 |
|
|
|
|
|
|
|
|
No Coll or Univ |
43,361 |
41,768 |
41,097 |
40,799 |
|
|
|
|
|
|
|
|
Some Coll or Univ - No Deg |
36,675 |
34,845 |
33,773 |
34,185 |
|
|
|
|
|
|
|
|
Associate Deg |
3,367 |
3,293 |
3,415 |
3,939 |
|
|
|
|
|
|
|
|
Bachelor's Deg |
4,921 |
4,775 |
5,028 |
5,247 |
|
|
|
|
|
|
|
|
Master's Deg or Higher |
2,115 |
1,950 |
2,089 |
2,176 |
|
|
|
|
|
|
|
|
Unknown |
22,151 |
22,516 |
21,081 |
18,924 |
|
|
|
|
|
|
|
|
Unduplicated Total |
112,590 |
109,147 |
106,483 |
105,270 |
|
|
|
|
|
|
|
|
|
|
|
|
|
|
|
|
|
|
|
|
|
% No Coll or Univ |
38.5% |
38.3% |
38.6% |
38.8% |
|
|
|
|
|
|
|
|
% Some Coll or Univ - No Deg |
32.6% |
31.9% |
31.7% |
32.5% |
|
|
|
|
|
|
|
|
% Associate Deg |
3.0% |
3.0% |
3.2% |
3.7% |
|
|
|
|
|
|
|
|
% Bachelor's Deg |
4.4% |
4.4% |
4.7% |
5.0% |
|
|
|
|
|
|
|
|
% Master's Deg or Higher |
1.9% |
1.8% |
2.0% |
2.1% |
|
|
|
|
|
|
|
|
% Unknown |
19.7% |
20.6% |
19.8% |
18.0% |
|
|
|
|
|
|
|
|
|
|
|
|
|
|
|
|
|
|
|
|
| |
Print in landscape for best results |
Last updated on |
May 15, 2018 |
|
| |
Unduplicated Total: Each student was counted only once in the
system-wide total. |
|
| |
Maricopa Community College District • Office of
Institutional Effectiveness • Maricopa Trends |
|
| |
https://asa.maricopa.edu/departments/institutional-effectiveness/data-and-projects/maricopa-trends |
|
|
|
|
|
|
|
|
|
|
|
|
|
|
|
|
|