|
|
|
|
|
|
|
|
|
|
|
|
|
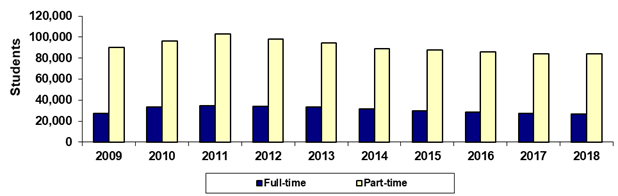
Maricopa County Community College District |
|
Spring 45th Day Full-time vs Part-time |
|
|
|
|
|
|
|
|
|
|
|
|
|
|
Year |
2009 |
2010 |
2011 |
2012 |
2013 |
2014 |
2015 |
2016 |
2017 |
2018 |
|
Full-time |
27,415 |
33,696 |
34,735 |
34,157 |
33,163 |
31,597 |
30,052 |
28,326 |
27,442 |
26,565 |
|
Part-time |
90,173 |
96,476 |
103,028 |
98,021 |
94,140 |
89,104 |
87,426 |
85,703 |
83,905 |
83,740 |
|
Sum of Colleges* |
117,588 |
130,172 |
137,763 |
132,178 |
127,303 |
120,701 |
117,478 |
114,029 |
111,347 |
110,305 |
|
|
|
|
|
|
|
|
|
|
|
|
|
% Full-time |
23.3% |
25.9% |
25.2% |
25.8% |
26.1% |
26.2% |
25.6% |
24.8% |
24.6% |
24.1% |
|
% Part-time |
76.7% |
74.1% |
74.8% |
74.2% |
73.9% |
73.8% |
74.4% |
75.2% |
75.4% |
75.9% |
|
|
|
|
|
|
|
|
|
|
|
|
|
Print in landscape for best results |
Last updated on |
May 15, 2018 |
|
*Sum of Colleges:
Each student was counted only once at each college the student
attended, but students who were |
|
enrolled in more than one college were counted
more than once in the Sum of Colleges. |
|
Note: A timing difference in data capture for
Spring 2015 resulted in 20 fewer students in this report than the official
number reported to |
|
the State. |
|
|
|
|
|
|
|
|
|
|
|
Source:
Official 45th Day headcount as reported by colleges. |
|
Maricopa Community College District • Office of
Institutional Effectiveness • Maricopa Trends |
|
https://asa.maricopa.edu/departments/institutional-effectiveness/data-and-projects/maricopa-trends |
|
|
|
|
|
|
|
|
|
|
|
|
|
|
|
|
|
|
|
|
|
|
|
|
|
|
|
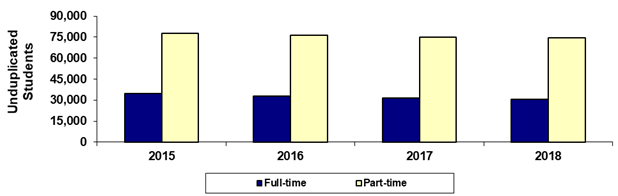
Maricopa County Community College District |
|
Spring 45th Day Full-time vs Part-time |
|
District-wide Unduplicated Total |
|
(Each student is counted only once) |
|
|
|
|
|
|
|
|
|
|
|
|
|
|
|
|
|
|
|
|
|
|
|
|
|
|
|
|
|
|
|
|
|
|
|
|
|
|
Year |
2015 |
2016 |
2017 |
2018 |
|
|
|
|
|
|
|
Full-time |
34,797 |
32,739 |
31,551 |
30,728 |
|
|
|
|
|
|
|
Part-time |
77,793 |
76,408 |
74,932 |
74,542 |
|
|
|
|
|
|
|
Unduplicated Total |
112,590 |
109,147 |
106,483 |
105,270 |
|
|
|
|
|
|
|
|
|
|
|
|
|
|
|
|
|
|
|
% Full-time |
30.9% |
30.0% |
29.6% |
29.2% |
|
|
|
|
|
|
|
% Part-time |
69.1% |
70.0% |
70.4% |
70.8% |
|
|
|
|
|
|
|
|
|
|
|
|
|
|
|
|
|
|
| |
Print in landscape for best results |
Last updated on |
May 15, 2018 |
| |
Unduplicated Total: Each student was counted only once in the
system-wide total. |
| |
Maricopa Community College District • Office of
Institutional Effectiveness • Maricopa Trends |
| |
https://asa.maricopa.edu/departments/institutional-effectiveness/data-and-projects/maricopa-trends |
|
|
|
|
|
|
|
|
|
|
|
|
|
|
|
|
|
|
|
|
|
|
|
|
|
|
|
|
|
|
|
|
|
|
|
|
|
|
|
|
|
|
|
|
|
|
|
|
|
|
|
|
|
|
|
|
|
|
|
|
|
|
|
|
|
|
|
|
|
|
|
|
|
|
|
|
|
|
|
|
|
|
|
|
|
|
|
|
|
|
|
|
|
|
|
|
|
|
|
|
|
|
|
|
|
|
|
|
|
|
|
|
|
|
|
|
|
|
|
|
|
|