|
|
|
|
|
|
|
|
|
|
|
|
|
Maricopa County Community College District |
|
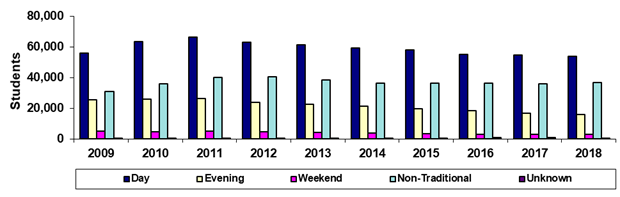
Spring 45th Day Primary Time of Attendance
Headcount |
|
|
|
|
|
|
|
|
|
|
|
|
|
|
Year |
2009 |
2010 |
2011 |
2012 |
2013 |
2014 |
2015 |
2016 |
2017 |
2018 |
|
Day |
55,849 |
63,362 |
66,064 |
62,839 |
61,460 |
59,039 |
57,927 |
55,216 |
54,585 |
53,906 |
|
Evening |
25,672 |
26,033 |
26,331 |
23,706 |
22,677 |
21,124 |
19,560 |
18,234 |
16,694 |
16,070 |
|
Weekend |
5,042 |
4,861 |
4,982 |
4,827 |
4,416 |
3,867 |
3,495 |
3,138 |
3,060 |
3,180 |
|
Non-Traditional |
30,862 |
35,685 |
40,190 |
40,496 |
38,309 |
36,227 |
36,087 |
36,348 |
35,969 |
36,854 |
|
Unknown |
163 |
231 |
196 |
310 |
441 |
444 |
409 |
1,093 |
1,039 |
295 |
|
Sum of Colleges* |
117,588 |
130,172 |
137,763 |
132,178 |
127,303 |
120,701 |
117,478 |
114,029 |
111,347 |
110,305 |
|
|
|
|
|
|
|
|
|
|
|
|
|
% Day |
47.5% |
48.7% |
48.0% |
47.5% |
48.3% |
48.9% |
49.3% |
48.4% |
49.0% |
48.9% |
|
% Evening |
21.8% |
20.0% |
19.1% |
17.9% |
17.8% |
17.5% |
16.6% |
16.0% |
15.0% |
14.6% |
|
%Weekend |
4.3% |
3.7% |
3.6% |
3.7% |
3.5% |
3.2% |
3.0% |
2.8% |
2.7% |
2.9% |
|
%Non-Traditional |
26.2% |
27.4% |
29.2% |
30.6% |
30.1% |
30.0% |
30.7% |
31.9% |
32.3% |
33.4% |
|
%Unknown |
0.1% |
0.2% |
0.1% |
0.2% |
0.3% |
0.4% |
0.3% |
1.0% |
0.9% |
0.3% |
|
|
|
|
|
|
|
|
|
|
|
|
|
Print in landscape for best results |
Last updated on |
May 15, 2018 |
|
*Sum of Colleges:
Each student was counted only once at each college the student
attended, but students who were |
|
enrolled in more than one college were counted
more than once in the Sum of Colleges. |
|
Note: A timing difference in data capture for
Spring 2015 resulted in 20 fewer students in this report than the official
number reported to |
|
the State. |
|
|
|
|
|
|
|
|
|
|
|
Source:
Official 45th Day headcount as reported by colleges. |
|
Maricopa Community College District • Office of
Institutional Effectiveness • Maricopa Trends |
|
https://asa.maricopa.edu/departments/institutional-effectiveness/data-and-projects/maricopa-trends |
|
|
|
|
|
|
|
|
|
|
|
|
|
|
|
|
|
|
|
|
|
|
|
|
|
|
|
|
|
|
|
|
|
|
|
|
|
|
|
Maricopa County Community College District |
|
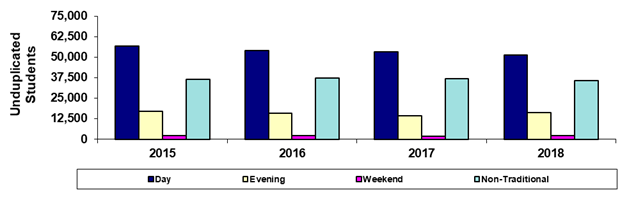
Spring 45th Day Primary Time of Attendance
Headcount |
|
District-wide Unduplicated Total |
|
(Each student is counted only once) |
|
|
|
|
|
|
|
|
|
|
|
|
|
|
|
|
|
|
|
|
|
|
|
|
|
|
Year |
2015 |
2016 |
2017 |
2018 |
|
|
|
|
|
|
|
Day |
56,928 |
53,918 |
53,098 |
51,280 |
|
|
|
|
|
|
|
Evening |
17,008 |
15,807 |
14,434 |
16,127 |
|
|
|
|
|
|
|
Weekend |
2,245 |
2,037 |
1,927 |
2,139 |
|
|
|
|
|
|
|
Non-Traditional |
36,409 |
37,385 |
37,024 |
35,724 |
|
|
|
|
|
|
|
Unduplicated Total |
112,590 |
109,147 |
106,483 |
105,270 |
|
|
|
|
|
|
|
|
|
|
|
|
|
|
|
|
|
|
|
% Day |
50.6% |
49.4% |
49.9% |
48.7% |
|
|
|
|
|
|
|
% Evening |
15.1% |
14.5% |
13.6% |
15.3% |
|
|
|
|
|
|
|
%Weekend |
2.0% |
1.9% |
1.8% |
2.0% |
|
|
|
|
|
|
|
%Non-Traditional |
32.3% |
34.3% |
34.8% |
33.9% |
|
|
|
|
|
|
|
|
|
|
|
|
|
|
|
|
|
|
| |
Print in landscape for best results |
Last updated on |
May 15, 2018 |
| |
Unduplicated Total: Each student was counted only once in the
system-wide total. |
| |
Maricopa Community College District • Office of
Institutional Effectiveness • Maricopa Trends |
| |
https://asa.maricopa.edu/departments/institutional-effectiveness/data-and-projects/maricopa-trends |
|
|
|
|
|
|
|
|
|
|
|
|
|
|