|
|
|
|
|
|
|
|
|
|
|
|
|
|
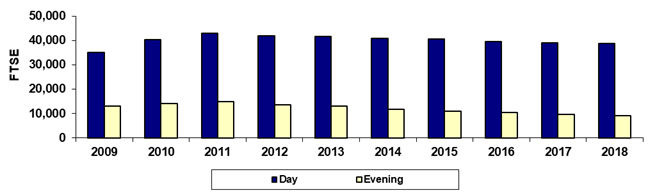
Maricopa County Community College District |
|
|
Spring 45th Day Day/Evening FTSE |
|
|
|
|
|
|
|
|
|
|
|
|
|
|
|
|
|
|
|
|
|
|
|
|
|
|
|
|
|
|
|
|
|
|
|
|
|
|
|
|
|
|
|
|
|
|
|
|
|
|
|
|
|
|
|
|
|
|
|
|
|
|
|
|
|
|
|
|
|
|
|
|
|
|
|
|
|
|
|
|
|
|
|
|
|
|
|
|
|
|
|
|
|
|
|
|
|
|
|
|
|
|
|
|
|
|
|
|
|
|
|
|
|
|
|
|
|
|
|
|
|
|
|
|
|
|
|
|
|
|
|
|
|
|
|
|
|
|
|
|
|
|
|
|
|
|
|
|
|
|
|
|
|
|
|
|
|
|
Year |
2009 |
2010 |
2011 |
2012 |
2013 |
2014 |
2015 |
2016 |
2017 |
2018 |
|
|
Day |
34,985.7 |
40,406.9 |
42,988.1 |
41,954.7 |
41,536.0 |
40,895.3 |
40,602.5 |
39,442.5 |
39,110.4 |
38,607.2 |
|
|
Evening |
13,060.9 |
14,094.4 |
14,805.5 |
13,631.6 |
13,098.3 |
11,614.7 |
11,014.6 |
10,469.4 |
9,613.2 |
9,013.3 |
|
|
Total |
48,046.6 |
54,501.3 |
57,793.6 |
55,586.3 |
54,634.4 |
52,510.1 |
51,617.1 |
49,911.9 |
48,723.7 |
47,620.5 |
|
|
|
|
|
|
|
|
|
|
|
|
|
|
|
% Day |
72.8% |
74.1% |
74.4% |
75.5% |
76.0% |
77.9% |
78.7% |
79.0% |
80.3% |
81.1% |
|
|
% Evening |
27.2% |
25.9% |
25.6% |
24.5% |
24.0% |
22.1% |
21.3% |
21.0% |
19.7% |
18.9% |
|
|
|
|
|
|
|
|
|
|
|
|
|
|
|
Due to rounding, the sum
of the numbers may not equal the Total. |
|
|
Last updated on |
May 15, 2018 |
|
|
Print in landscape for best results |
|
|
|
|
Source:
Official 45th Day FTSE numbers as reported by the colleges after
manual adjustments (unaudited). |
|
|
Maricopa Community College District • Office of
Institutional Effectiveness • Maricopa Trends |
|
|
https://asa.maricopa.edu/departments/institutional-effectiveness/data-and-projects/maricopa-trends |
|
|
|
|
|
|
|
|
|
|
|
|
|
|
|
|
|