|
|
|
|
|
|
|
|
|
|
|
|
|
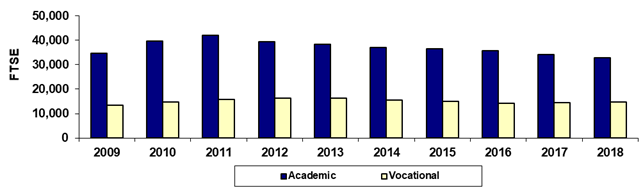
Maricopa County Community College District |
|
Spring 45th Day Academic/Vocational FTSE |
|
|
|
|
|
|
|
|
|
|
|
|
|
|
Year |
2009 |
2010 |
2011 |
2012 |
2013 |
2014 |
2015 |
2016 |
2017 |
2018 |
|
Academic |
34,702.6 |
39,658.3 |
41,939.0 |
39,292.1 |
38,351.1 |
37,004.3 |
36,503.6 |
35,635.4 |
34,240.3 |
32,845.7 |
|
Vocational |
13,344.0 |
14,843.0 |
15,854.6 |
16,294.2 |
16,283.3 |
15,505.7 |
15,113.6 |
14,276.5 |
14,483.4 |
14,774.9 |
|
Total |
48,046.6 |
54,501.3 |
57,793.6 |
55,586.3 |
54,634.4 |
52,510.1 |
51,617.1 |
49,911.9 |
48,723.7 |
47,620.5 |
|
|
|
|
|
|
|
|
|
|
|
|
|
% Academic |
72.2% |
72.8% |
72.6% |
70.7% |
70.2% |
70.5% |
70.7% |
71.4% |
70.3% |
69.0% |
|
% Vocational |
27.8% |
27.2% |
27.4% |
29.3% |
29.8% |
29.5% |
29.3% |
28.6% |
29.7% |
31.0% |
|
|
|
|
|
|
|
|
|
|
|
|
|
Due to rounding, the sum
of the numbers may not equal the Total. |
|
|
Last updated on |
May 15, 2018 |
|
Print in landscape for best results |
|
|
|
Source:
Official 45th Day FTSE numbers as reported by the colleges after
manual adjustments (unaudited). |
|
Maricopa Community College District • Office of
Institutional Effectiveness • Maricopa Trends |
|
https://asa.maricopa.edu/departments/institutional-effectiveness/data-and-projects/maricopa-trends |
|
|
|
|
|
|
|
|
|
|
|
|
|
|
|