|
|
|
|
|
|
|
|
|
|
|
|
|
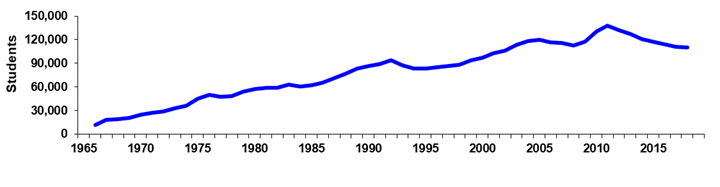
Maricopa County Community College District |
|
Spring 45th Day Historical Headcount |
|
|
|
|
|
|
|
|
|
|
|
|
|
Year |
1960 |
1961 |
1962 |
1963 |
1964 |
1965 |
1966 |
1967 |
1968 |
1969 |
|
Day |
|
|
|
|
|
|
4,456 |
8,521 |
9,821 |
11,282 |
|
% Change |
|
|
|
|
|
|
0.0% |
91.2% |
15.3% |
14.9% |
|
Evening |
|
|
|
|
|
|
7,564 |
9,280 |
8,987 |
9,691 |
|
% Change |
|
|
|
|
|
|
0.0% |
22.7% |
-3.2% |
7.8% |
|
Sum of Colleges* |
|
|
|
|
|
|
12,020 |
17,801 |
18,808 |
20,973 |
|
% Change |
|
|
|
|
|
|
0.0% |
48.1% |
5.7% |
11.5% |
|
|
|
|
|
|
|
|
|
|
|
|
|
Year |
1970 |
1971 |
1972 |
1973 |
1974 |
1975 |
1976 |
1977 |
1978 |
1979 |
|
Day |
12,466 |
14,938 |
15,546 |
15,790 |
16,172 |
22,415 |
26,325 |
22,395 |
21,771 |
21,694 |
|
% Change |
10.5% |
19.8% |
4.1% |
1.6% |
2.4% |
38.6% |
17.4% |
-14.9% |
-2.8% |
-0.4% |
|
Evening |
12,473 |
12,418 |
13,214 |
17,159 |
19,842 |
22,338 |
23,222 |
25,320 |
26,433 |
32,110 |
|
% Change |
28.7% |
-0.4% |
6.4% |
29.9% |
15.6% |
12.6% |
4.0% |
9.0% |
4.4% |
21.5% |
|
Sum of Colleges* |
24,939 |
27,356 |
28,760 |
32,949 |
36,014 |
44,753 |
49,547 |
47,715 |
48,204 |
53,804 |
|
% Change |
18.9% |
9.7% |
5.1% |
14.6% |
9.3% |
24.3% |
10.7% |
-3.7% |
1.0% |
11.6% |
|
|
|
|
|
|
|
|
|
|
|
|
|
Year |
1980 |
1981 |
1982 |
1983 |
1984 |
1985 |
1986 |
1987 |
1988 |
1989 |
|
Day |
22,570 |
23,769 |
25,171 |
27,239 |
26,321 |
25,393 |
27,639 |
30,175 |
33,453 |
36,939 |
|
% Change |
4.0% |
5.3% |
5.9% |
8.2% |
-3.4% |
-3.5% |
8.8% |
9.2% |
10.9% |
10.4% |
|
Evening |
34,328 |
35,460 |
33,888 |
35,934 |
34,358 |
36,777 |
37,916 |
41,151 |
43,298 |
46,051 |
|
% Change |
6.9% |
3.3% |
-4.4% |
6.0% |
-4.4% |
7.0% |
3.1% |
8.5% |
5.2% |
6.4% |
|
Sum of Colleges* |
56,898 |
59,229 |
59,059 |
63,173 |
60,679 |
62,170 |
65,555 |
71,326 |
76,751 |
82,990 |
|
% Change |
5.8% |
4.1% |
-0.3% |
7.0% |
-3.9% |
2.5% |
5.4% |
8.8% |
7.6% |
8.1% |
|
|
|
|
|
|
|
|
|
|
|
|
|
Year |
1990 |
1991 |
1992 |
1993 |
1994 |
1995 |
1996 |
1997 |
1998 |
1999 |
|
Day |
40,814 |
43,845 |
47,708 |
46,027 |
43,571 |
42,851 |
44,060 |
44,137 |
45,642 |
48,735 |
|
% Change |
10.5% |
7.4% |
8.8% |
-3.5% |
-5.3% |
-1.7% |
2.8% |
0.2% |
3.4% |
6.8% |
|
Evening |
45,770 |
44,796 |
46,549 |
41,400 |
39,452 |
40,677 |
41,246 |
42,226 |
42,732 |
45,511 |
|
% Change |
-0.6% |
-2.1% |
3.9% |
-11.1% |
-4.7% |
3.1% |
1.4% |
2.4% |
1.2% |
6.5% |
|
Sum of Colleges* |
86,584 |
88,641 |
94,257 |
87,427 |
83,023 |
83,528 |
85,306 |
86,363 |
88,374 |
94,246 |
|
% Change |
4.3% |
2.4% |
6.3% |
-7.2% |
-5.0% |
0.6% |
2.1% |
1.2% |
2.3% |
6.6% |
|
|
|
|
|
|
|
|
|
|
|
|
|
Year |
2000 |
2001 |
2002 |
2003 |
2004 |
2005 |
2006 |
2007 |
2008 |
2009 |
|
Day |
54,290 |
57,439 |
59,193 |
64,045 |
67,853 |
69,472 |
68,387 |
68,889 |
0 |
0 |
|
% Change |
11.4% |
5.8% |
3.1% |
8.2% |
5.9% |
2.4% |
-1.6% |
0.7% |
0.0% |
0.0% |
|
Evening |
42,977 |
45,405 |
46,702 |
48,996 |
50,039 |
50,150 |
48,573 |
46,952 |
0 |
0 |
|
% Change |
-5.6% |
5.6% |
2.9% |
4.9% |
2.1% |
0.2% |
-3.1% |
-3.3% |
0.0% |
0.0% |
|
Sum of Colleges* |
97,267 |
102,844 |
105,895 |
113,041 |
117,892 |
119,622 |
116,960 |
115,841 |
112,250 |
117,588 |
|
% Change |
3.2% |
5.7% |
3.0% |
6.7% |
4.3% |
1.5% |
-2.2% |
-1.0% |
-3.1% |
4.8% |
|
|
|
|
|
|
|
|
|
|
|
|
|
Year |
2010 |
2011 |
2012 |
2013 |
2014 |
2015 |
2016 |
2017 |
2018 |
|
|
Day |
0 |
|
|
|
|
|
|
|
|
|
|
% Change |
0.0% |
|
|
|
|
|
|
|
|
|
|
Evening |
0 |
|
|
|
|
|
|
|
|
|
|
% Change |
0.0% |
|
|
|
|
|
|
|
|
|
|
Sum of Colleges* |
130,172 |
137,763 |
132,178 |
127,303 |
120,701 |
117,478 |
114,029 |
111,347 |
110,305 |
|
|
% Change |
10.7% |
5.8% |
-4.1% |
-3.7% |
-5.2% |
-2.7% |
-2.9% |
-2.4% |
-0.9% |
|
|
|
|
|
|
|
|
|
|
|
|
|
|
|
|
|
|
|
|
|
|
|
|
|
|
Print in landscape for best results |
Last updated on |
May 15, 2018 |
|
*Sum of Colleges:
Each student was counted only once at each college the student
attended, but students who were |
|
enrolled in more than one college were counted
more than once in the Sum of Colleges. |
|
Note: A timing difference in data capture for
Spring 2015 resulted in 20 fewer students in this report than the official
number reported to |
|
the State. |
|
|
|
|
|
|
|
|
|
|
|
Source:
Official 45th Day headcount as reported by colleges. |
|
Maricopa Community College District • Office of
Institutional Effectiveness • Maricopa Trends |
|
https://asa.maricopa.edu/departments/institutional-effectiveness/data-and-projects/maricopa-trends |
|
|
|
|
|
|
|
|
|
|
|
|
|
|
|
|