|
|
|
|
|
|
|
|
|
|
|
|
|
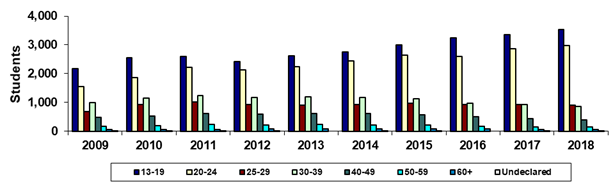
Estrella Mountain Community College |
|
Spring 45th Day Age Groups |
|
|
|
|
|
|
|
|
|
|
|
|
|
|
|
|
|
|
|
|
|
|
|
|
|
Year |
2009 |
2010 |
2011 |
2012 |
2013 |
2014 |
2015 |
2016 |
2017 |
2018 |
|
13-19 |
2,184 |
2,549 |
2,589 |
2,422 |
2,626 |
2,760 |
2,989 |
3,242 |
3,349 |
3,526 |
|
20-24 |
1,548 |
1,864 |
2,218 |
2,138 |
2,237 |
2,452 |
2,637 |
2,599 |
2,864 |
2,987 |
|
25-29 |
683 |
928 |
1,011 |
927 |
901 |
922 |
968 |
931 |
937 |
907 |
|
30-39 |
987 |
1,140 |
1,233 |
1,181 |
1,185 |
1,174 |
1,127 |
969 |
933 |
852 |
|
40-49 |
474 |
530 |
607 |
597 |
624 |
615 |
566 |
514 |
435 |
402 |
|
50-59 |
170 |
186 |
230 |
218 |
241 |
223 |
211 |
166 |
155 |
142 |
|
60+ |
49 |
63 |
69 |
71 |
81 |
87 |
75 |
73 |
62 |
49 |
|
Undeclared |
11 |
9 |
2 |
1 |
0 |
1 |
2 |
0 |
3 |
1 |
|
Total |
6,106 |
7,269 |
7,959 |
7,555 |
7,895 |
8,234 |
8,575 |
8,494 |
8,738 |
8,866 |
|
|
|
|
|
|
|
|
|
|
|
|
|
% 13-19 |
35.8% |
35.1% |
32.5% |
32.1% |
33.3% |
33.5% |
34.9% |
38.2% |
38.3% |
39.8% |
|
% 20-24 |
25.4% |
25.6% |
27.9% |
28.3% |
28.3% |
29.8% |
30.8% |
30.6% |
32.8% |
33.7% |
|
% 25-29 |
11.2% |
12.8% |
12.7% |
12.3% |
11.4% |
11.2% |
11.3% |
11.0% |
10.7% |
10.2% |
|
% 30-39 |
16.2% |
15.7% |
15.5% |
15.6% |
15.0% |
14.3% |
13.1% |
11.4% |
10.7% |
9.6% |
|
% 40-49 |
7.8% |
7.3% |
7.6% |
7.9% |
7.9% |
7.5% |
6.6% |
6.1% |
5.0% |
4.5% |
|
% 50-59 |
2.8% |
2.6% |
2.9% |
2.9% |
3.1% |
2.7% |
2.5% |
2.0% |
1.8% |
1.6% |
|
% 60+ |
0.8% |
0.9% |
0.9% |
0.9% |
1.0% |
1.1% |
0.9% |
0.9% |
0.7% |
0.6% |
|
% Undeclared |
0.2% |
0.1% |
0.0% |
0.0% |
0.0% |
0.0% |
0.0% |
0.0% |
0.0% |
0.0% |
|
|
|
|
|
|
|
|
|
|
|
|
|
Print in landscape for
best results |
|
|
|
|
|
Last updated on |
May 15, 2018 |
|
Source:
Official 45th Day headcount as reported by colleges. |
|
Maricopa Community College District • Office of
Institutional Effectiveness • Maricopa Trends |
|
https://asa.maricopa.edu/departments/institutional-effectiveness/data-and-projects/maricopa-trends |
|
|
|
|
|
|
|
|
|
|
|
|
|
|