|
|
|
|
|
|
|
|
|
|
|
|
|
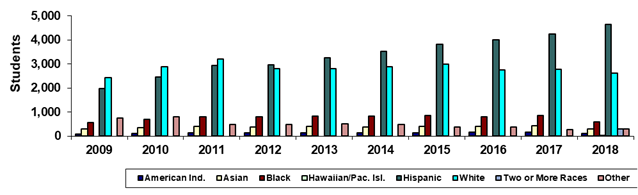
Estrella Mountain Community College |
|
Spring 45th Day Ethnicity |
|
|
|
|
|
|
|
|
|
|
|
|
|
|
Year |
2009 |
2010 |
2011 |
2012 |
2013 |
2014 |
2015 |
2016 |
2017 |
2018 |
|
American Ind. |
87 |
103 |
128 |
133 |
126 |
128 |
145 |
154 |
170 |
105 |
|
Asian |
303 |
345 |
395 |
378 |
401 |
386 |
397 |
413 |
421 |
293 |
|
Black |
566 |
694 |
798 |
800 |
818 |
824 |
862 |
814 |
845 |
601 |
|
Hawaiian/Pac. Isl. |
0 |
0 |
0 |
0 |
0 |
0 |
0 |
0 |
0 |
26 |
|
Hispanic |
1,976 |
2,455 |
2,941 |
2,973 |
3,246 |
3,521 |
3,804 |
3,995 |
4,245 |
4,649 |
|
White |
2,432 |
2,872 |
3,207 |
2,796 |
2,789 |
2,889 |
2,988 |
2,753 |
2,776 |
2,620 |
|
Two or More Races |
0 |
0 |
0 |
0 |
0 |
0 |
0 |
0 |
0 |
289 |
|
Other |
742 |
800 |
490 |
475 |
515 |
486 |
379 |
365 |
281 |
283 |
|
Total |
6,106 |
7,269 |
7,959 |
7,555 |
7,895 |
8,234 |
8,575 |
8,494 |
8,738 |
8,866 |
|
|
|
|
|
|
|
|
|
|
|
|
|
% American Ind. |
1.4% |
1.4% |
1.6% |
1.8% |
1.6% |
1.6% |
1.7% |
1.8% |
1.9% |
1.2% |
|
% Asian |
5.0% |
4.7% |
5.0% |
5.0% |
5.1% |
4.7% |
4.6% |
4.9% |
4.8% |
3.3% |
|
% Black |
9.3% |
9.5% |
10.0% |
10.6% |
10.4% |
10.0% |
10.1% |
9.6% |
9.7% |
6.8% |
|
% Hawaiian/Pac. Isl. |
0.0% |
0.0% |
0.0% |
0.0% |
0.0% |
0.0% |
0.0% |
0.0% |
0.0% |
0.3% |
|
% Hispanic |
32.4% |
33.8% |
37.0% |
39.4% |
41.1% |
42.8% |
44.4% |
47.0% |
48.6% |
52.4% |
|
% White |
39.8% |
39.5% |
40.3% |
37.0% |
35.3% |
35.1% |
34.8% |
32.4% |
31.8% |
29.6% |
|
% Two or More Races |
0.0% |
0.0% |
0.0% |
0.0% |
0.0% |
0.0% |
0.0% |
0.0% |
0.0% |
3.3% |
|
% Other |
12.2% |
11.0% |
6.2% |
6.3% |
6.5% |
5.9% |
4.4% |
4.3% |
3.2% |
3.2% |
|
|
|
|
|
|
|
|
|
|
|
|
|
Print in landscape for
best results |
|
|
|
|
|
Last updated on |
May 15, 2018 |
|
Source:
Official 45th Day headcount as reported by colleges. |
|
Maricopa Community College District • Office of
Institutional Effectiveness • Maricopa Trends |
|
https://asa.maricopa.edu/departments/institutional-effectiveness/data-and-projects/maricopa-trends |
|
|
|
|
*Beginning in Spring
2018, race-ethnicity categories changed to provide counts for
"Hawaiian/Pacific Islander" and "Two or more races." |
|
|
|
|
|
|
|
|
|
|
|
|