|
|
|
|
|
|
|
|
|
|
|
|
|
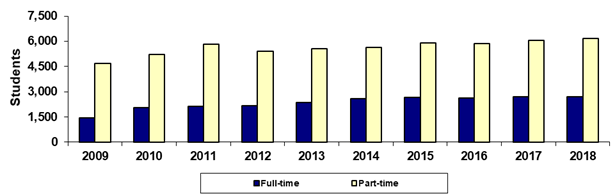
Estrella Mountain Community College |
|
Spring 45th Day Full-time vs Part-time |
|
|
|
|
|
|
|
|
|
|
|
|
|
|
Year |
2009 |
2010 |
2011 |
2012 |
2013 |
2014 |
2015 |
2016 |
2017 |
2018 |
|
Full-time |
1,426 |
2,040 |
2,136 |
2,150 |
2,348 |
2,588 |
2,660 |
2,614 |
2,700 |
2,696 |
|
Part-time |
4,680 |
5,229 |
5,823 |
5,405 |
5,547 |
5,646 |
5,915 |
5,880 |
6,038 |
6,170 |
|
Sum of Colleges* |
6,106 |
7,269 |
7,959 |
7,555 |
7,895 |
8,234 |
8,575 |
8,494 |
8,738 |
8,866 |
|
|
|
|
|
|
|
|
|
|
|
|
|
% Full-time |
23.4% |
28.1% |
26.8% |
28.5% |
29.7% |
31.4% |
31.0% |
30.8% |
30.9% |
30.4% |
|
% Part-time |
76.6% |
71.9% |
73.2% |
71.5% |
70.3% |
68.6% |
69.0% |
69.2% |
69.1% |
69.6% |
|
|
|
|
|
|
|
|
|
|
|
|
|
Print in landscape for
best results |
|
|
|
|
|
Last updated on |
May 15, 2018 |
|
Source:
Official 45th Day headcount as reported by colleges. |
|
Maricopa Community College District • Office of
Institutional Effectiveness • Maricopa Trends |
|
https://asa.maricopa.edu/departments/institutional-effectiveness/data-and-projects/maricopa-trends |
|
|
|
|
|
|
|
|
|
|
|
|
|
|
|
|
|
|
|
|
|
|
|
|
|
|
|
|
|
|
|
|
|
|
|
|
|
|
|
|
|
|
|
|
|
|
|
|
|
|
|
|
|
|
|
|
|
|
|
|
|
|
|
|
|
|
|
|
|
|
|
|
|
|
|
|
|
|
|
|
|
|
|
|
|
|
|
|
|
|
|
|
|
|
|
|
|
|
|
|
|
|
|
|
|
|
|
|
|
|
|
|
|
|
|
|
|
|
|
|
|
|
|
|
|
|
|
|
|
|
|
|
|
|
|
|
|
|
|
|
|
|
|
|
|
|
|
|
|
|
|
|
|
|
|
|
|
|
|
|
|
|
|
|
|
|
|
|
|
|