|
|
|
|
|
|
|
|
|
|
|
|
|
|
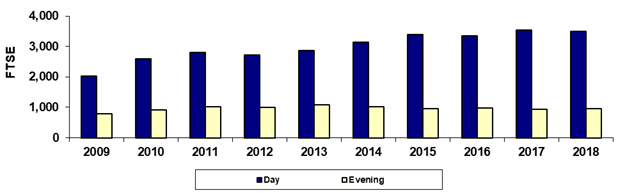
Estrella Mountain Community College |
|
|
Spring 45th Day Day/Evening FTSE |
|
|
|
|
|
|
|
|
|
|
|
|
|
|
|
|
|
|
|
|
|
|
|
|
|
|
|
|
|
|
|
|
|
|
|
|
|
|
|
|
|
|
|
|
|
|
|
|
|
|
|
|
|
|
|
|
|
|
|
|
|
|
|
|
|
|
|
|
|
|
|
|
|
|
|
|
|
|
|
|
|
|
|
|
|
|
|
|
|
|
|
|
|
|
|
|
|
|
|
|
|
|
|
|
|
|
|
|
|
|
|
|
|
|
|
|
|
|
|
|
|
|
|
|
|
|
|
|
|
|
|
|
|
|
|
|
|
|
|
|
|
|
|
|
|
|
|
|
|
|
|
|
|
|
|
|
|
|
Year |
2009 |
2010 |
2011 |
2012 |
2013 |
2014 |
2015 |
2016 |
2017 |
2018 |
|
|
Day |
2,019.0 |
2,598.4 |
2,805.2 |
2,711.1 |
2,870.3 |
3,132.5 |
3,386.0 |
3,354.5 |
3,536.5 |
3,504.3 |
|
|
Evening |
789.8 |
908.9 |
1,022.9 |
1,009.0 |
1,080.9 |
1,011.7 |
957.2 |
979.2 |
943.7 |
967.6 |
|
|
Total |
2,808.8 |
3,507.3 |
3,828.0 |
3,720.1 |
3,951.1 |
4,144.1 |
4,343.2 |
4,333.7 |
4,480.2 |
4,471.9 |
|
|
|
|
|
|
|
|
|
|
|
|
|
|
|
% Day |
71.9% |
74.1% |
73.3% |
72.9% |
72.6% |
75.6% |
78.0% |
77.4% |
78.9% |
78.4% |
|
|
% Evening |
28.1% |
25.9% |
26.7% |
27.1% |
27.4% |
24.4% |
22.0% |
22.6% |
21.1% |
21.6% |
|
|
|
|
|
|
|
|
|
|
|
|
|
|
|
Due to rounding, the sum
of the numbers may not equal the Total. |
|
|
Last updated on |
May 15, 2018 |
|
|
Print in landscape for best results |
|
|
|
|
Source:
Official 45th Day FTSE numbers as reported by the colleges after
manual adjustments (unaudited). |
|
|
Maricopa Community College District • Office of
Institutional Effectiveness • Maricopa Trends |
|
|
https://asa.maricopa.edu/departments/institutional-effectiveness/data-and-projects/maricopa-trends |
|
|
|
|
|
|
|
|
|
|
|
|
|
|
|
|