|
|
|
|
|
|
|
|
|
|
|
|
|
Estrella Mountain Community College |
|
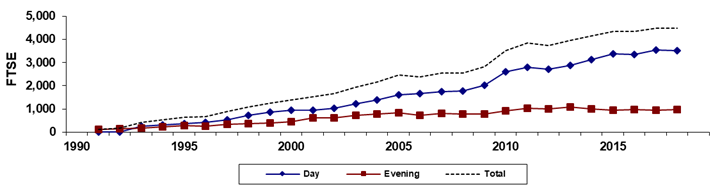
Spring 45th Day Historical Day/Evening FTSE |
|
|
|
|
|
|
|
|
|
|
|
|
|
|
|
|
|
|
|
|
|
|
|
|
|
Year |
1990 |
1991 |
1992 |
1993 |
1994 |
1995 |
1996 |
1997 |
1998 |
1999 |
|
Day |
|
2.6 |
5.4 |
259.3 |
314.2 |
358.1 |
410.9 |
533.9 |
729.1 |
854.8 |
|
% Change |
|
0.0% |
107.7% |
4701.9% |
21.2% |
14.0% |
14.7% |
29.9% |
36.6% |
17.2% |
|
Evening |
|
113.6 |
153.7 |
168.6 |
227.5 |
272.7 |
244.9 |
350.9 |
367.2 |
394.9 |
|
% Change |
|
0.0% |
35.3% |
9.7% |
34.9% |
19.9% |
-10.2% |
43.3% |
4.6% |
7.5% |
|
Total |
|
116.2 |
159.1 |
427.9 |
541.7 |
630.8 |
655.8 |
884.8 |
1,096.3 |
1,249.7 |
|
% Change |
|
0 |
36.9% |
169.0% |
26.6% |
16.4% |
4.0% |
34.9% |
23.9% |
14.0% |
|
|
|
|
|
|
|
|
|
|
|
|
|
Year |
2000 |
2001 |
2002 |
2003 |
2004 |
2005 |
2006 |
2007 |
2008 |
2009 |
|
Day |
950.5 |
931.7 |
1,034.6 |
1,207.8 |
1,382.9 |
1,617.5 |
1,668.0 |
1,733.7 |
1,780.9 |
2,019.0 |
|
% Change |
11.2% |
-2.0% |
11.0% |
16.7% |
14.5% |
17.0% |
3.1% |
3.9% |
2.7% |
13.4% |
|
Evening |
434.7 |
602.7 |
622.3 |
729.8 |
772.1 |
835.6 |
713.2 |
797.5 |
773.7 |
789.8 |
|
% Change |
10.1% |
38.7% |
3.3% |
17.3% |
5.8% |
8.2% |
-14.6% |
11.8% |
-3.0% |
2.1% |
|
Total |
1,385.1 |
1,534.3 |
1,656.9 |
1,937.6 |
2,155.0 |
2,453.1 |
2,381.2 |
2,531.2 |
2,554.6 |
2,808.8 |
|
% Change |
10.8% |
10.8% |
8.0% |
16.9% |
11.2% |
13.8% |
-2.9% |
6.3% |
0.9% |
10.0% |
|
|
|
|
|
|
|
|
|
|
|
|
|
Year |
2010 |
2011 |
2012 |
2013 |
2014 |
2015 |
2016 |
2017 |
2018 |
|
|
Day |
2,598.4 |
2,805.2 |
2,711.1 |
2,870.3 |
3,132.5 |
3,386.0 |
3,354.5 |
3,536.5 |
3,504.3 |
|
|
% Change |
28.7% |
8.0% |
-3.4% |
5.9% |
9.1% |
8.1% |
-0.9% |
5.4% |
-0.9% |
|
|
Evening |
908.9 |
1,022.9 |
1,009.0 |
1,080.9 |
1,011.7 |
957.2 |
979.2 |
943.7 |
967.6 |
|
|
% Change |
15.1% |
12.5% |
-1.4% |
7.1% |
-6.4% |
-5.4% |
2.3% |
-3.6% |
2.5% |
|
|
Total |
3,507.3 |
3,828.0 |
3,720.1 |
3,951.1 |
4,144.1 |
4,343.2 |
4,333.7 |
4,480.2 |
4,471.9 |
|
|
% Change |
24.9% |
9.1% |
-2.8% |
6.2% |
4.9% |
4.8% |
-0.2% |
3.4% |
-0.2% |
|
|
|
|
|
|
|
|
|
|
|
|
|
|
|
|
|
|
|
|
|
|
|
|
|
|
Due to rounding, the sum
of the numbers may not equal the Total. |
|
|
Last updated on |
May 15, 2018 |
|
Print in landscape for best results |
|
|
|
Source:
Official 45th Day FTSE numbers as reported by the colleges after
manual adjustments (unaudited). |
|
Maricopa Community College District • Office of
Institutional Effectiveness • Maricopa Trends |
|
https://asa.maricopa.edu/departments/institutional-effectiveness/data-and-projects/maricopa-trends |
|
|
|
|
|
|
|
|
|
|
|
|
|
|
|
|