|
|
|
|
|
|
|
|
|
|
|
|
|
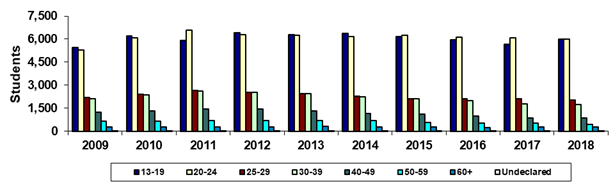
Glendale Community College |
|
Spring 45th Day Age Groups |
|
|
|
|
|
|
|
|
|
|
|
|
|
|
|
|
|
|
|
|
|
|
|
|
|
Year |
2009 |
2010 |
2011 |
2012 |
2013 |
2014 |
2015 |
2016 |
2017 |
2018 |
|
13-19 |
5,452 |
6,186 |
5,901 |
6,425 |
6,292 |
6,371 |
6,153 |
5,942 |
5,682 |
5,987 |
|
20-24 |
5,292 |
6,077 |
6,565 |
6,309 |
6,228 |
6,153 |
6,247 |
6,143 |
6,075 |
5,990 |
|
25-29 |
2,184 |
2,387 |
2,675 |
2,533 |
2,466 |
2,302 |
2,135 |
2,110 |
2,117 |
2,038 |
|
30-39 |
2,129 |
2,350 |
2,617 |
2,531 |
2,458 |
2,250 |
2,105 |
1,999 |
1,766 |
1,727 |
|
40-49 |
1,244 |
1,311 |
1,454 |
1,434 |
1,333 |
1,162 |
1,115 |
977 |
863 |
857 |
|
50-59 |
635 |
640 |
693 |
700 |
707 |
701 |
563 |
545 |
512 |
453 |
|
60+ |
275 |
259 |
269 |
299 |
305 |
295 |
273 |
255 |
263 |
262 |
|
Undeclared |
11 |
9 |
8 |
3 |
6 |
4 |
3 |
3 |
6 |
4 |
|
Total |
17,222 |
19,219 |
20,182 |
20,234 |
19,795 |
19,238 |
18,594 |
17,974 |
17,284 |
17,318 |
|
|
|
|
|
|
|
|
|
|
|
|
|
% 13-19 |
31.7% |
32.2% |
29.2% |
31.8% |
31.8% |
33.1% |
33.1% |
33.1% |
32.9% |
34.6% |
|
% 20-24 |
30.7% |
31.6% |
32.5% |
31.2% |
31.5% |
32.0% |
33.6% |
34.2% |
35.1% |
34.6% |
|
% 25-29 |
12.7% |
12.4% |
13.3% |
12.5% |
12.5% |
12.0% |
11.5% |
11.7% |
12.2% |
11.8% |
|
% 30-39 |
12.4% |
12.2% |
13.0% |
12.5% |
12.4% |
11.7% |
11.3% |
11.1% |
10.2% |
10.0% |
|
% 40-49 |
7.2% |
6.8% |
7.2% |
7.1% |
6.7% |
6.0% |
6.0% |
5.4% |
5.0% |
4.9% |
|
% 50-59 |
3.7% |
3.3% |
3.4% |
3.5% |
3.6% |
3.6% |
3.0% |
3.0% |
3.0% |
2.6% |
|
% 60+ |
1.6% |
1.3% |
1.3% |
1.5% |
1.5% |
1.5% |
1.5% |
1.4% |
1.5% |
1.5% |
|
% Undeclared |
0.1% |
0.0% |
0.0% |
0.0% |
0.0% |
0.0% |
0.0% |
0.0% |
0.0% |
0.0% |
|
|
|
|
|
|
|
|
|
|
|
|
|
Print in landscape for
best results |
|
|
|
|
|
Last updated on |
May 15, 2018 |
|
Source:
Official 45th Day headcount as reported by colleges. |
|
Maricopa Community College District • Office of
Institutional Effectiveness • Maricopa Trends |
|
https://asa.maricopa.edu/departments/institutional-effectiveness/data-and-projects/maricopa-trends |
|
|
|
|
|
|
|
|
|
|
|
|
|
|