|
|
|
|
|
|
|
|
|
|
|
|
|
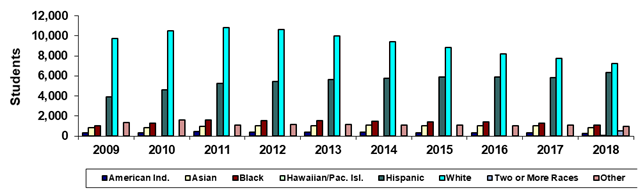
Glendale Community College |
|
Spring 45th Day Ethnicity |
|
|
|
|
|
|
|
|
|
|
|
|
|
|
Year |
2009 |
2010 |
2011 |
2012 |
2013 |
2014 |
2015 |
2016 |
2017 |
2018 |
|
American Ind. |
333 |
338 |
426 |
409 |
405 |
388 |
350 |
338 |
335 |
265 |
|
Asian |
859 |
861 |
993 |
1,046 |
1,020 |
1,096 |
1,040 |
1,055 |
1,040 |
860 |
|
Black |
1,052 |
1,267 |
1,607 |
1,570 |
1,570 |
1,502 |
1,443 |
1,400 |
1,288 |
1,101 |
|
Hawaiian/Pac. Isl. |
0 |
0 |
0 |
0 |
0 |
0 |
0 |
0 |
0 |
48 |
|
Hispanic |
3,920 |
4,635 |
5,242 |
5,459 |
5,650 |
5,765 |
5,862 |
5,914 |
5,816 |
6,322 |
|
White |
9,724 |
10,514 |
10,821 |
10,607 |
9,998 |
9,382 |
8,810 |
8,217 |
7,742 |
7,235 |
|
Two or More Races |
0 |
0 |
0 |
0 |
0 |
0 |
0 |
0 |
0 |
511 |
|
Other |
1,334 |
1,604 |
1,093 |
1,143 |
1,152 |
1,105 |
1,089 |
1,050 |
1,063 |
976 |
|
Total |
17,222 |
19,219 |
20,182 |
20,234 |
19,795 |
19,238 |
18,594 |
17,974 |
17,284 |
17,318 |
|
|
|
|
|
|
|
|
|
|
|
|
|
% American Ind. |
1.9% |
1.8% |
2.1% |
2.0% |
2.0% |
2.0% |
1.9% |
1.9% |
1.9% |
1.5% |
|
% Asian |
5.0% |
4.5% |
4.9% |
5.2% |
5.2% |
5.7% |
5.6% |
5.9% |
6.0% |
5.0% |
|
% Black |
6.1% |
6.6% |
8.0% |
7.8% |
7.9% |
7.8% |
7.8% |
7.8% |
7.5% |
6.4% |
|
% Hawaiian/Pac. Isl. |
0.0% |
0.0% |
0.0% |
0.0% |
0.0% |
0.0% |
0.0% |
0.0% |
0.0% |
0.3% |
|
% Hispanic |
22.8% |
24.1% |
26.0% |
27.0% |
28.5% |
30.0% |
31.5% |
32.9% |
33.6% |
36.5% |
|
% White |
56.5% |
54.7% |
53.6% |
52.4% |
50.5% |
48.8% |
47.4% |
45.7% |
44.8% |
41.8% |
|
% Two or More Races |
0.0% |
0.0% |
0.0% |
0.0% |
0.0% |
0.0% |
0.0% |
0.0% |
0.0% |
3.0% |
|
% Other |
7.7% |
8.3% |
5.4% |
5.6% |
5.8% |
5.7% |
5.9% |
5.8% |
6.2% |
5.6% |
|
|
|
|
|
|
|
|
|
|
|
|
|
Print in landscape for
best results |
|
|
|
|
|
Last updated on |
May 15, 2018 |
|
Source:
Official 45th Day headcount as reported by colleges. |
|
Maricopa Community College District • Office of
Institutional Effectiveness • Maricopa Trends |
|
https://asa.maricopa.edu/departments/institutional-effectiveness/data-and-projects/maricopa-trends |
|
|
|
|
*Beginning in Spring
2018, race-ethnicity categories changed to provide counts for
"Hawaiian/Pacific Islander" and "Two or more races." |
|
|
|
|
|
|
|
|
|
|
|
|