|
|
|
|
|
|
|
|
|
|
|
|
|
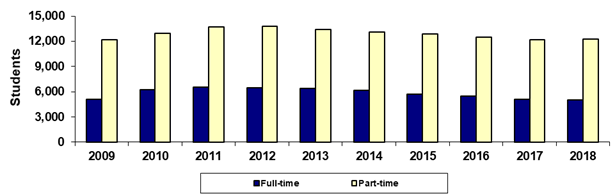
Glendale Community College |
|
Spring 45th Day Full-time vs Part-time |
|
|
|
|
|
|
|
|
|
|
|
|
|
|
Year |
2009 |
2010 |
2011 |
2012 |
2013 |
2014 |
2015 |
2016 |
2017 |
2018 |
|
Full-time |
5,066 |
6,251 |
6,507 |
6,470 |
6,377 |
6,153 |
5,741 |
5,497 |
5,083 |
5,028 |
|
Part-time |
12,156 |
12,968 |
13,675 |
13,764 |
13,418 |
13,085 |
12,853 |
12,477 |
12,201 |
12,290 |
|
Sum of Colleges* |
17,222 |
19,219 |
20,182 |
20,234 |
19,795 |
19,238 |
18,594 |
17,974 |
17,284 |
17,318 |
|
|
|
|
|
|
|
|
|
|
|
|
|
% Full-time |
29.4% |
32.5% |
32.2% |
32.0% |
32.2% |
32.0% |
30.9% |
30.6% |
29.4% |
29.0% |
|
% Part-time |
70.6% |
67.5% |
67.8% |
68.0% |
67.8% |
68.0% |
69.1% |
69.4% |
70.6% |
71.0% |
|
|
|
|
|
|
|
|
|
|
|
|
| |
Print in landscape for
best results |
|
|
|
|
|
Last updated on |
May 15, 2018 |
| |
Source:
Official 45th Day headcount as reported by colleges. |
| |
Maricopa Community College District • Office of
Institutional Effectiveness • Maricopa Trends |
| |
https://asa.maricopa.edu/departments/institutional-effectiveness/data-and-projects/maricopa-trends |
|
|
|
|
|
|
|
|
|
|
|
|
|
|
|
|
|
|
|
|
|
|
|
|
|
|
|
|
|
|
|
|
|
|
|
|
|
|
|
|
|
|
|
|
|
|
|
|
|
|
|
|
|
|
|
|
|
|
|
|
|
|
|
|
|
|
|
|
|
|
|
|
|
|
|
|
|
|
|
|
|
|
|
|
|
|
|
|
|
|
|
|
|
|
|
|
|
|
|
|
|
|
|
|
|
|
|
|
|
|
|
|
|
|
|
|
|
|
|
|
|
|
|
|
|
|
|
|
|
|
|
|
|
|
|
|
|
|
|
|
|
|
|
|
|
|
|
|
|
|
|
|
|
|
|
|
|
|
|
|
|
|
|
|
|
|
|
|
|
|