|
|
|
|
|
|
|
|
|
|
|
|
|
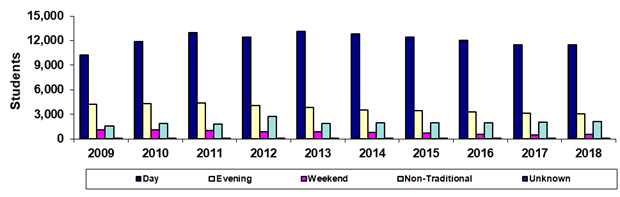
Glendale Community College |
|
Spring 45th Day Primary Time of Attendance
Headcount |
|
|
|
|
|
|
|
|
|
|
|
|
|
|
Year |
2009 |
2010 |
2011 |
2012 |
2013 |
2014 |
2015 |
2016 |
2017 |
2018 |
|
Day |
10,271 |
11,911 |
12,969 |
12,459 |
13,093 |
12,836 |
12,437 |
12,011 |
11,512 |
11,466 |
|
Evening |
4,234 |
4,316 |
4,370 |
4,105 |
3,862 |
3,530 |
3,456 |
3,326 |
3,160 |
3,047 |
|
Weekend |
1,106 |
1,084 |
1,027 |
892 |
903 |
824 |
686 |
569 |
510 |
599 |
|
Non-Traditional |
1,602 |
1,883 |
1,775 |
2,722 |
1,888 |
1,983 |
1,951 |
1,999 |
2,019 |
2,145 |
|
Unknown |
9 |
25 |
41 |
56 |
49 |
65 |
64 |
69 |
83 |
61 |
|
Total |
17,222 |
19,219 |
20,182 |
20,234 |
19,795 |
19,238 |
18,594 |
17,974 |
17,284 |
17,318 |
|
|
|
|
|
|
|
|
|
|
|
|
|
% Day |
59.6% |
62.0% |
64.3% |
61.6% |
66.1% |
66.7% |
66.9% |
66.8% |
66.6% |
66.2% |
|
% Evening |
24.6% |
22.5% |
21.7% |
20.3% |
19.5% |
18.3% |
18.6% |
18.5% |
18.3% |
17.6% |
|
%Weekend |
6.4% |
5.6% |
5.1% |
4.4% |
4.6% |
4.3% |
3.7% |
3.2% |
3.0% |
3.5% |
|
%Non-Traditional |
9.3% |
9.8% |
8.8% |
13.5% |
9.5% |
10.3% |
10.5% |
11.1% |
11.7% |
12.4% |
|
%Unknown |
0.1% |
0.1% |
0.2% |
0.3% |
0.2% |
0.3% |
0.3% |
0.4% |
0.5% |
0.4% |
|
|
|
|
|
|
|
|
|
|
|
|
| |
Print in landscape for
best results |
|
|
|
|
|
Last updated on |
May 15, 2018 |
| |
Source:
Official 45th Day headcount as reported by colleges. |
| |
Maricopa Community College District • Office of
Institutional Effectiveness • Maricopa Trends |
| |
https://asa.maricopa.edu/departments/institutional-effectiveness/data-and-projects/maricopa-trends |
|
|
|
|
|
|
|
|
|
|
|
|
|
|