|
|
|
|
|
|
|
|
|
|
|
|
|
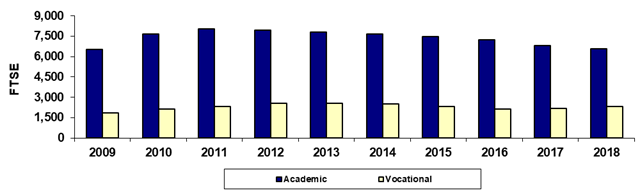
Glendale Community College |
|
Spring 45th Day Academic/Vocational FTSE |
|
|
|
|
|
|
|
|
|
|
|
|
|
|
Year |
2009 |
2010 |
2011 |
2012 |
2013 |
2014 |
2015 |
2016 |
2017 |
2018 |
|
Academic |
6,532.4 |
7,655.4 |
8,046.8 |
7,948.1 |
7,820.8 |
7,645.3 |
7,458.1 |
7,239.6 |
6,784.0 |
6,588.9 |
|
Vocational |
1,858.2 |
2,137.5 |
2,344.2 |
2,538.0 |
2,576.0 |
2,495.1 |
2,322.6 |
2,139.5 |
2,176.1 |
2,309.0 |
|
Total |
8,390.6 |
9,792.9 |
10,391.0 |
10,486.1 |
10,396.8 |
10,140.4 |
9,780.6 |
9,379.1 |
8,960.1 |
8,898.0 |
|
|
|
|
|
|
|
|
|
|
|
|
|
% Academic |
77.9% |
78.2% |
77.4% |
75.8% |
75.2% |
75.4% |
76.3% |
77.2% |
75.7% |
74.0% |
|
% Vocational |
22.1% |
21.8% |
22.6% |
24.2% |
24.8% |
24.6% |
23.7% |
22.8% |
24.3% |
26.0% |
|
|
|
|
|
|
|
|
|
|
|
|
|
Due to rounding, the sum
of the numbers may not equal the Total. |
|
|
Last updated on |
May 15, 2018 |
|
Print in landscape for best results |
|
|
|
Source:
Official 45th Day FTSE numbers as reported by the colleges after
manual adjustments (unaudited). |
|
Maricopa Community College District • Office of
Institutional Effectiveness • Maricopa Trends |
|
https://asa.maricopa.edu/departments/institutional-effectiveness/data-and-projects/maricopa-trends |
|
|
|
|
|
|
|
|
|
|
|
|
|
|
|