|
|
|
|
|
|
|
|
|
|
|
|
|
|
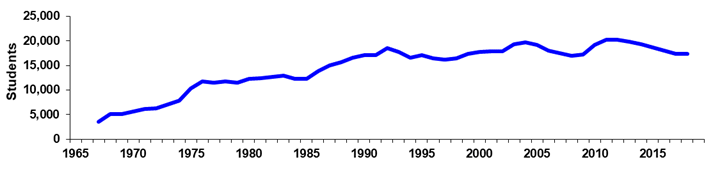
Glendale Community College |
|
|
Spring 45th Day Historical Headcount |
|
|
|
|
|
|
|
|
|
|
|
|
|
|
|
|
|
|
|
|
|
|
|
|
|
Year |
1960 |
1961 |
1962 |
1963 |
1964 |
1965 |
1966 |
1967 |
1968 |
1969 |
|
|
Day |
|
|
|
|
|
|
|
2,175 |
2,774 |
3,134 |
|
|
% Change |
|
|
|
|
|
|
|
0.0% |
27.5% |
13.0% |
|
|
Evening |
|
|
|
|
|
|
|
1,416 |
2,303 |
1,966 |
|
|
% Change |
|
|
|
|
|
|
|
0.0% |
62.6% |
-14.6% |
|
|
Total |
|
|
|
|
|
|
|
3,591 |
5,077 |
5,100 |
|
|
% Change |
|
|
|
|
|
|
|
0.0% |
41.4% |
0.5% |
|
|
|
|
|
|
|
|
|
|
|
|
|
|
|
Year |
1970 |
1971 |
1972 |
1973 |
1974 |
1975 |
1976 |
1977 |
1978 |
1979 |
|
|
Day |
3,413 |
3,784 |
3,751 |
3,705 |
3,813 |
5,558 |
6,953 |
5,544 |
5,496 |
5,430 |
|
|
% Change |
8.9% |
10.9% |
-0.9% |
-1.2% |
2.9% |
45.8% |
25.1% |
-20.3% |
-0.9% |
-1.2% |
|
|
Evening |
2,194 |
2,423 |
2,564 |
3,404 |
4,055 |
4,818 |
4,831 |
5,939 |
6,246 |
6,047 |
|
|
% Change |
11.6% |
10.4% |
5.8% |
32.8% |
19.1% |
18.8% |
0.3% |
22.9% |
5.2% |
-3.2% |
|
|
Total |
5,607 |
6,207 |
6,315 |
7,109 |
7,868 |
10,376 |
11,784 |
11,483 |
11,742 |
11,477 |
|
|
% Change |
9.9% |
10.7% |
1.7% |
12.6% |
10.7% |
31.9% |
13.6% |
-2.6% |
2.3% |
-2.3% |
|
|
|
|
|
|
|
|
|
|
|
|
|
|
|
Year |
1980 |
1981 |
1982 |
1983 |
1984 |
1985 |
1986 |
1987 |
1988 |
1989 |
|
|
Day |
5,719 |
5,854 |
6,130 |
6,593 |
6,102 |
5,859 |
6,660 |
7,263 |
7,857 |
8,529 |
|
|
% Change |
5.3% |
2.4% |
4.7% |
7.6% |
-7.4% |
-4.0% |
13.7% |
9.1% |
8.2% |
8.6% |
|
|
Evening |
6,572 |
6,597 |
6,556 |
6,363 |
6,125 |
6,444 |
7,153 |
7,722 |
7,748 |
7,974 |
|
|
% Change |
8.7% |
0.4% |
-0.6% |
-2.9% |
-3.7% |
5.2% |
11.0% |
8.0% |
0.3% |
2.9% |
|
|
Total |
12,291 |
12,451 |
12,686 |
12,956 |
12,227 |
12,303 |
13,813 |
14,985 |
15,605 |
16,503 |
|
|
% Change |
7.1% |
1.3% |
1.9% |
2.1% |
-5.6% |
0.6% |
12.3% |
8.5% |
4.1% |
5.8% |
|
|
|
|
|
|
|
|
|
|
|
|
|
|
|
Year |
1990 |
1991 |
1992 |
1993 |
1994 |
1995 |
1996 |
1997 |
1998 |
1999 |
|
|
Day |
9,141 |
9,655 |
10,550 |
10,056 |
9,447 |
9,542 |
9,285 |
9,165 |
9,130 |
9,540 |
|
|
% Change |
7.2% |
5.6% |
9.3% |
-4.7% |
-6.1% |
1.0% |
-2.7% |
-1.3% |
-0.4% |
4.5% |
|
|
Evening |
7,927 |
7,477 |
7,964 |
7,695 |
7,069 |
7,577 |
7,189 |
6,956 |
7,258 |
7,745 |
|
|
% Change |
-0.6% |
-5.7% |
6.5% |
-3.4% |
-8.1% |
7.2% |
-5.1% |
-3.2% |
4.3% |
6.7% |
|
|
Total |
17,068 |
17,132 |
18,514 |
17,751 |
16,516 |
17,119 |
16,474 |
16,121 |
16,388 |
17,285 |
|
|
% Change |
3.4% |
0.4% |
8.1% |
-4.1% |
-7.0% |
3.7% |
-3.8% |
-2.1% |
1.7% |
5.5% |
|
|
|
|
|
|
|
|
|
|
|
|
|
|
|
Year |
2000 |
2001 |
2002 |
2003 |
2004 |
2005 |
2006 |
2007 |
2008 |
2009 |
|
|
Day |
9,666 |
9,871 |
10,183 |
10,850 |
11,471 |
11,174 |
10,596 |
10,683 |
0 |
0 |
|
|
% Change |
1.3% |
2.1% |
3.2% |
6.6% |
5.7% |
-2.6% |
-5.2% |
0.8% |
0.0% |
0.0% |
|
|
Evening |
8,049 |
7,967 |
7,715 |
8,475 |
8,263 |
7,980 |
7,399 |
6,850 |
0 |
0 |
|
|
% Change |
3.9% |
-1.0% |
-3.2% |
9.9% |
-2.5% |
-3.4% |
-7.3% |
-7.4% |
0.0% |
0.0% |
|
|
Total |
17,715 |
17,838 |
17,898 |
19,325 |
19,734 |
19,154 |
17,995 |
17,533 |
16,905 |
17,222 |
|
|
% Change |
2.5% |
0.7% |
0.3% |
8.0% |
2.1% |
-2.9% |
-6.1% |
-2.6% |
-3.6% |
1.9% |
|
|
|
|
|
|
|
|
|
|
|
|
|
|
|
Year |
2010 |
2011 |
2012 |
2013 |
2014 |
2015 |
2016 |
2017 |
2018 |
|
|
|
Day |
0 |
|
|
|
|
|
|
|
|
|
|
|
% Change |
0.0% |
|
|
|
|
|
|
|
|
|
|
|
Evening |
0 |
|
|
|
|
|
|
|
|
|
|
|
% Change |
0.0% |
|
|
|
|
|
|
|
|
|
|
|
Total |
19,219 |
20,182 |
20,234 |
19,795 |
19,238 |
18,594 |
17,974 |
17,284 |
17,318 |
|
|
|
% Change |
11.6% |
5.0% |
0.3% |
-2.2% |
-2.8% |
-3.3% |
-3.3% |
-3.8% |
0.2% |
|
|
|
|
|
|
|
|
|
|
|
|
|
|
|
|
|
|
|
|
|
|
|
|
|
|
|
|
| |
Print in landscape for
best results |
|
|
|
|
|
Last updated on |
May 15, 2018 |
|
| |
Source:
Official 45th Day headcount as reported by colleges. |
|
| |
Maricopa Community College District • Office of
Institutional Effectiveness • Maricopa Trends |
|
| |
https://asa.maricopa.edu/departments/institutional-effectiveness/data-and-projects/maricopa-trends |
|
|
|
|
|
|
|
|
|
|
|
|
|
|
|
|
|
|