|
|
|
|
|
|
|
|
|
|
|
|
|
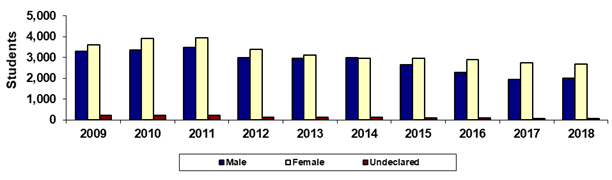
GateWay Community College |
|
Spring 45th Day Gender |
|
|
|
|
|
|
|
|
|
|
|
|
|
|
|
|
|
|
|
|
|
|
|
|
|
Year |
2009 |
2010 |
2011 |
2012 |
2013 |
2014 |
2015 |
2016 |
2017 |
2018 |
|
Male |
3,289 |
3,341 |
3,487 |
2,981 |
2,971 |
2,983 |
2,653 |
2,270 |
1,936 |
2,004 |
|
Female |
3,607 |
3,911 |
3,927 |
3,393 |
3,123 |
2,969 |
2,968 |
2,885 |
2,747 |
2,683 |
|
Undeclared |
203 |
215 |
202 |
137 |
135 |
118 |
107 |
79 |
78 |
71 |
|
Total |
7,099 |
7,467 |
7,616 |
6,511 |
6,229 |
6,070 |
5,728 |
5,234 |
4,761 |
4,758 |
|
|
|
% Male |
46.3% |
44.7% |
45.8% |
45.8% |
47.7% |
49.1% |
46.3% |
43.4% |
40.7% |
42.1% |
|
% Female |
50.8% |
52.4% |
51.6% |
52.1% |
50.1% |
48.9% |
51.8% |
55.1% |
57.7% |
56.4% |
|
% Undeclared |
2.9% |
2.9% |
2.7% |
2.1% |
2.2% |
1.9% |
1.9% |
1.5% |
1.6% |
1.5% |
|
|
|
|
|
|
|
|
|
|
|
|
|
Print in landscape for
best results |
|
|
|
|
|
Last updated on |
May 15, 2018 |
|
Note: A timing difference in data capture for
Spring 2015 resulted in 1 fewer student in this report than the official
number reported to the State. |
|
|
|
|
|
|
|
|
|
|
|
|
|
Source:
Official 45th Day headcount as reported by colleges. |
|
Maricopa Community College District • Office of
Institutional Effectiveness • Maricopa Trends |
|
https://asa.maricopa.edu/departments/institutional-effectiveness/data-and-projects/maricopa-trends |
|
|
|
|
|
|
|
|
|
|
|
|
|
|