|
|
|
|
|
|
|
|
|
|
|
|
|
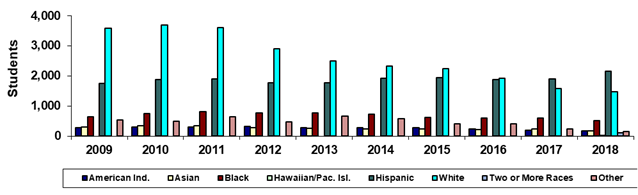
GateWay Community College |
|
Spring 45th Day Ethnicity |
|
|
|
|
|
|
|
|
|
|
|
|
|
|
Year |
2009 |
2010 |
2011 |
2012 |
2013 |
2014 |
2015 |
2016 |
2017 |
2018 |
|
American Ind. |
277 |
293 |
304 |
320 |
282 |
285 |
285 |
228 |
191 |
175 |
|
Asian |
291 |
335 |
348 |
283 |
256 |
243 |
230 |
208 |
242 |
179 |
|
Black |
638 |
749 |
804 |
772 |
770 |
731 |
625 |
606 |
597 |
521 |
|
Hawaiian/Pac. Isl. |
0 |
0 |
0 |
0 |
0 |
0 |
0 |
0 |
0 |
13 |
|
Hispanic |
1,755 |
1,887 |
1,906 |
1,763 |
1,765 |
1,911 |
1,943 |
1,879 |
1,900 |
2,147 |
|
White |
3,595 |
3,702 |
3,602 |
2,901 |
2,492 |
2,331 |
2,240 |
1,912 |
1,586 |
1,464 |
|
Two or More Races |
0 |
0 |
0 |
0 |
0 |
0 |
0 |
0 |
0 |
115 |
|
Other |
543 |
501 |
652 |
472 |
664 |
569 |
405 |
401 |
245 |
144 |
|
Total |
7,099 |
7,467 |
7,616 |
6,511 |
6,229 |
6,070 |
5,728 |
5,234 |
4,761 |
4,758 |
|
|
|
|
|
|
|
|
|
|
|
|
|
% American Ind. |
3.9% |
3.9% |
4.0% |
4.9% |
4.5% |
4.7% |
5.0% |
4.4% |
4.0% |
3.7% |
|
% Asian |
4.1% |
4.5% |
4.6% |
4.3% |
4.1% |
4.0% |
4.0% |
4.0% |
5.1% |
3.8% |
|
% Black |
9.0% |
10.0% |
10.6% |
11.9% |
12.4% |
12.0% |
10.9% |
11.6% |
12.5% |
10.9% |
|
% Hawaiian/Pac. Isl. |
0.0% |
0.0% |
0.0% |
0.0% |
0.0% |
0.0% |
0.0% |
0.0% |
0.0% |
0.3% |
|
% Hispanic |
24.7% |
25.3% |
25.0% |
27.1% |
28.3% |
31.5% |
33.9% |
35.9% |
39.9% |
45.1% |
|
% White |
50.6% |
49.6% |
47.3% |
44.6% |
40.0% |
38.4% |
39.1% |
36.5% |
33.3% |
30.8% |
|
% Two or More Races |
0.0% |
0.0% |
0.0% |
0.0% |
0.0% |
0.0% |
0.0% |
0.0% |
0.0% |
2.4% |
|
% Other |
7.6% |
6.7% |
8.6% |
7.2% |
10.7% |
9.4% |
7.1% |
7.7% |
5.1% |
3.0% |
|
|
|
|
|
|
|
|
|
|
|
|
|
Print in landscape for
best results |
|
|
|
|
|
Last updated on |
May 15, 2018 |
|
Note: A timing difference in data capture for
Spring 2015 resulted in 1 fewer student in this report than the official
number reported to the State. |
|
|
|
|
|
|
|
|
|
|
|
|
|
Source:
Official 45th Day headcount as reported by colleges. |
|
Maricopa Community College District • Office of
Institutional Effectiveness • Maricopa Trends |
|
https://asa.maricopa.edu/departments/institutional-effectiveness/data-and-projects/maricopa-trends |
|
|
|
|
|
|
|
|
|
|
|
|
|
|
|
|
|
|
|
|
|
|
|
|
|
|
|