|
|
|
|
|
|
|
|
|
|
|
|
|
|
GateWay Community College |
|
|
Spring 45th Day Admission Status |
|
|
|
|
|
|
|
|
|
|
|
|
|
|
|
|
|
|
|
|
|
|
|
|
|
|
|
|
|
|
|
|
|
|
|
|
|
|
|
|
|
|
|
|
|
|
|
|
|
|
|
|
|
|
|
|
|
|
|
|
|
|
|
|
|
|
|
|
|
|
|
|
|
|
|
|
|
|
|
|
|
|
|
|
|
|
|
|
|
|
|
|
|
|
|
|
|
|
|
|
|
|
|
|
|
|
|
|
|
|
|
|
|
|
|
|
|
|
|
|
|
|
|
|
|
|
|
|
|
|
|
|
|
|
|
|
|
|
|
|
|
|
|
|
|
|
|
|
|
|
|
|
|
|
|
|
|
|
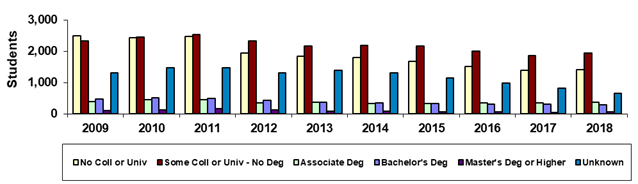
Year |
2009 |
2010 |
2011 |
2012 |
2013 |
2014 |
2015 |
2016 |
2017 |
2018 |
|
|
No Coll or Univ |
2,491 |
2,428 |
2,483 |
1,942 |
1,842 |
1,796 |
1,673 |
1,506 |
1,390 |
1,419 |
|
|
Some Coll or Univ - No Deg |
2,327 |
2,457 |
2,542 |
2,334 |
2,159 |
2,199 |
2,164 |
2,010 |
1,857 |
1,952 |
|
|
Associate Deg |
389 |
452 |
453 |
354 |
375 |
325 |
338 |
351 |
348 |
373 |
|
|
Bachelor's Deg |
473 |
514 |
500 |
431 |
368 |
357 |
340 |
311 |
303 |
298 |
|
|
Master's Deg or Higher |
110 |
134 |
166 |
130 |
95 |
76 |
69 |
69 |
48 |
56 |
|
|
Unknown |
1,309 |
1,482 |
1,472 |
1,320 |
1,390 |
1,317 |
1,144 |
987 |
815 |
660 |
|
|
Total |
7,099 |
7,467 |
7,616 |
6,511 |
6,229 |
6,070 |
5,728 |
5,234 |
4,761 |
4,758 |
|
|
|
|
|
|
|
|
|
|
|
|
|
|
|
|
|
|
|
|
|
|
|
|
|
|
|
|
% No Coll or Univ |
35.1% |
32.5% |
32.6% |
29.8% |
29.6% |
29.6% |
29.2% |
28.8% |
29.2% |
29.8% |
|
|
% Some Coll or Univ - No Deg |
32.8% |
32.9% |
33.4% |
35.8% |
34.7% |
36.2% |
37.8% |
38.4% |
39.0% |
41.0% |
|
|
% Associate Deg |
5.5% |
6.1% |
5.9% |
5.4% |
6.0% |
5.4% |
5.9% |
6.7% |
7.3% |
7.8% |
|
|
% Bachelor's Deg |
6.7% |
6.9% |
6.6% |
6.6% |
5.9% |
5.9% |
5.9% |
5.9% |
6.4% |
6.3% |
|
|
% Master's Deg or Higher |
1.5% |
1.8% |
2.2% |
2.0% |
1.5% |
1.3% |
1.2% |
1.3% |
1.0% |
1.2% |
|
|
% Unknown |
18.4% |
19.8% |
19.3% |
20.3% |
22.3% |
21.7% |
20.0% |
18.9% |
17.1% |
13.9% |
|
|
|
|
|
|
|
|
|
|
|
|
|
|
|
|
|
|
|
|
|
|
|
|
|
|
|
| |
Print in landscape for best results |
|
|
|
|
|
|
Last updated on |
May 15, 2018 |
|
| |
Note: A timing difference in data capture for
Spring 2015 resulted in 1 fewer student in this report than the official
number reported to the State. |
|
| |
|
|
|
|
|
|
|
|
|
|
|
|
| |
Source:
Official 45th Day headcount as reported by colleges. |
|
| |
Maricopa Community College District • Office of
Institutional Effectiveness • Maricopa Trends |
|
| |
https://asa.maricopa.edu/departments/institutional-effectiveness/data-and-projects/maricopa-trends |
|
|
|
|
|
|
|
|
|
|
|
|
|
|
|
|
|