|
|
|
|
|
|
|
|
|
|
|
|
|
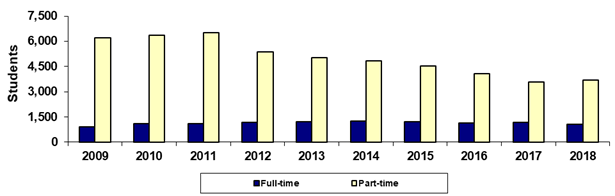
GateWay Community College |
|
Spring 45th Day Full-time vs Part-time |
|
|
|
|
|
|
|
|
|
|
|
|
|
|
Year |
2009 |
2010 |
2011 |
2012 |
2013 |
2014 |
2015 |
2016 |
2017 |
2018 |
|
Full-time |
902 |
1,103 |
1,100 |
1,163 |
1,205 |
1,243 |
1,214 |
1,148 |
1,175 |
1,055 |
|
Part-time |
6,197 |
6,364 |
6,516 |
5,348 |
5,024 |
4,827 |
4,514 |
4,086 |
3,586 |
3,703 |
|
Sum of Colleges* |
7,099 |
7,467 |
7,616 |
6,511 |
6,229 |
6,070 |
5,728 |
5,234 |
4,761 |
4,758 |
|
|
|
|
|
|
|
|
|
|
|
|
|
% Full-time |
12.7% |
14.8% |
14.4% |
17.9% |
19.3% |
20.5% |
21.2% |
21.9% |
24.7% |
22.2% |
|
% Part-time |
87.3% |
85.2% |
85.6% |
82.1% |
80.7% |
79.5% |
78.8% |
78.1% |
75.3% |
77.8% |
|
|
|
|
|
|
|
|
|
|
|
|
| |
Print in landscape for
best results |
|
|
|
|
|
Last updated on |
May 15, 2018 |
| |
Note: A timing difference in data capture for
Spring 2015 resulted in 1 fewer student in this report than the official
number reported to the State. |
| |
|
|
|
|
|
|
|
|
|
|
|
| |
Source:
Official 45th Day headcount as reported by colleges. |
| |
Maricopa Community College District • Office of
Institutional Effectiveness • Maricopa Trends |
| |
https://asa.maricopa.edu/departments/institutional-effectiveness/data-and-projects/maricopa-trends |
|
|
|
|
|
|
|
|
|
|
|
|
|
|
|
|
|
|
|
|
|
|
|
|
|
|
|
|
|
|
|
|
|
|
|
|
|
|
|
|
|
|
|
|
|
|
|
|
|
|
|
|
|
|
|
|
|
|
|
|
|
|
|
|
|
|
|
|
|
|
|
|
|
|
|
|
|
|
|
|
|
|
|
|
|
|
|
|
|
|
|
|
|
|
|
|
|
|
|
|
|
|
|
|
|
|
|
|
|
|
|
|
|
|
|
|
|
|
|
|
|
|
|
|
|
|
|
|
|
|
|
|
|
|
|
|
|
|
|
|
|
|
|
|
|
|
|
|
|
|
|
|
|
|
|
|
|
|
|
|
|
|
|
|
|
|
|
|
|
|