|
|
|
|
|
|
|
|
|
|
|
|
|
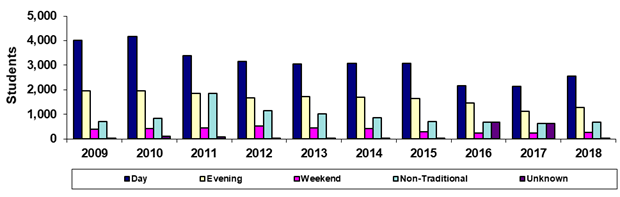
GateWay Community College |
|
Spring 45th Day Primary Time of Attendance
Headcount |
|
|
|
|
|
|
|
|
|
|
|
|
|
|
Year |
2009 |
2010 |
2011 |
2012 |
2013 |
2014 |
2015 |
2016 |
2017 |
2018 |
|
Day |
4,018 |
4,162 |
3,400 |
3,145 |
3,042 |
3,077 |
3,064 |
2,169 |
2,138 |
2,544 |
|
Evening |
1,961 |
1,959 |
1,865 |
1,680 |
1,711 |
1,688 |
1,648 |
1,449 |
1,128 |
1,277 |
|
Weekend |
398 |
414 |
437 |
518 |
439 |
421 |
296 |
242 |
233 |
264 |
|
Non-Traditional |
714 |
827 |
1,843 |
1,156 |
1,030 |
869 |
701 |
688 |
623 |
669 |
|
Unknown |
8 |
105 |
71 |
12 |
7 |
15 |
19 |
686 |
639 |
4 |
|
Total |
7,099 |
7,467 |
7,616 |
6,511 |
6,229 |
6,070 |
5,728 |
5,234 |
4,761 |
4,758 |
|
|
|
|
|
|
|
|
|
|
|
|
|
% Day |
56.6% |
55.7% |
44.6% |
48.3% |
48.8% |
50.7% |
53.5% |
41.4% |
44.9% |
53.5% |
|
% Evening |
27.6% |
26.2% |
24.5% |
25.8% |
27.5% |
27.8% |
28.8% |
27.7% |
23.7% |
26.8% |
|
%Weekend |
5.6% |
5.5% |
5.7% |
8.0% |
7.0% |
6.9% |
5.2% |
4.6% |
4.9% |
5.5% |
|
%Non-Traditional |
10.1% |
11.1% |
24.2% |
17.8% |
16.5% |
14.3% |
12.2% |
13.1% |
13.1% |
14.1% |
|
%Unknown |
0.1% |
1.4% |
0.9% |
0.2% |
0.1% |
0.2% |
0.3% |
13.1% |
13.4% |
0.1% |
|
|
|
|
|
|
|
|
|
|
|
|
| |
Print in landscape for
best results |
|
|
|
|
|
Last updated on |
May 15, 2018 |
| |
Note: A timing difference in data capture for
Spring 2015 resulted in 1 fewer student in this report than the official
number reported to the State. |
| |
|
|
|
|
|
|
|
|
|
|
|
| |
Source:
Official 45th Day headcount as reported by colleges. |
| |
Maricopa Community College District • Office of
Institutional Effectiveness • Maricopa Trends |
| |
https://asa.maricopa.edu/departments/institutional-effectiveness/data-and-projects/maricopa-trends |
|
|
|
|
|
|
|
|
|
|
|
|
|
|