|
|
|
|
|
|
|
|
|
|
|
|
|
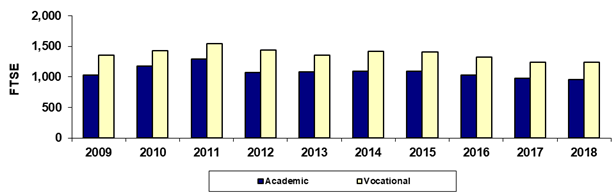
GateWay Community College |
|
Spring 45th Day Academic/Vocational FTSE |
|
|
|
|
|
|
|
|
|
|
|
|
|
|
Year |
2009 |
2010 |
2011 |
2012 |
2013 |
2014 |
2015 |
2016 |
2017 |
2018 |
|
Academic |
1,030.9 |
1,175.2 |
1,295.0 |
1,073.3 |
1,087.5 |
1,090.1 |
1,090.5 |
1,027.3 |
981.1 |
953.5 |
|
Vocational |
1,360.1 |
1,432.7 |
1,544.9 |
1,439.1 |
1,358.8 |
1,419.1 |
1,405.9 |
1,323.6 |
1,235.1 |
1,241.5 |
|
Total |
2,390.9 |
2,607.9 |
2,839.9 |
2,512.4 |
2,446.4 |
2,509.1 |
2,496.4 |
2,351.0 |
2,216.3 |
2,195.1 |
|
|
|
|
|
|
|
|
|
|
|
|
|
% Academic |
43.1% |
45.1% |
45.6% |
42.7% |
44.5% |
43.4% |
43.7% |
43.7% |
44.3% |
43.4% |
|
% Vocational |
56.9% |
54.9% |
54.4% |
57.3% |
55.5% |
56.6% |
56.3% |
56.3% |
55.7% |
56.6% |
|
|
|
|
|
|
|
|
|
|
|
|
|
Due to rounding, the sum
of the numbers may not equal the Total. |
|
|
Last updated on |
May 15, 2018 |
|
Print in landscape for best results |
|
|
|
Source:
Official 45th Day FTSE numbers as reported by the colleges after
manual adjustments (unaudited). |
|
Maricopa Community College District • Office of
Institutional Effectiveness • Maricopa Trends |
|
https://asa.maricopa.edu/departments/institutional-effectiveness/data-and-projects/maricopa-trends |
|
|
|
|
|
|
|
|
|
|
|
|
|
|