|
|
|
|
|
|
|
|
|
|
|
|
|
|
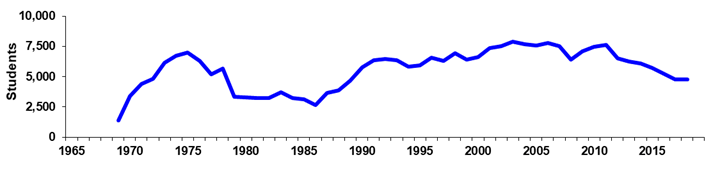
GateWay Community College |
|
|
Spring 45th Day Historical Headcount |
|
|
|
|
|
|
|
|
|
|
|
|
|
|
|
|
|
|
|
|
|
|
|
|
|
Year |
1960 |
1961 |
1962 |
1963 |
1964 |
1965 |
1966 |
1967 |
1968 |
1969 |
|
|
Day |
|
|
|
|
|
|
|
|
|
610 |
|
|
% Change |
|
|
|
|
|
|
|
|
|
0.0% |
|
|
Evening |
|
|
|
|
|
|
|
|
|
751 |
|
|
% Change |
|
|
|
|
|
|
|
|
|
0.0% |
|
|
Total |
|
|
|
|
|
|
|
|
|
1,361 |
|
|
% Change |
|
|
|
|
|
|
|
|
|
0.0% |
|
|
|
|
|
|
|
|
|
|
|
|
|
|
|
Year |
1970 |
1971 |
1972 |
1973 |
1974 |
1975 |
1976 |
1977 |
1978 |
1979 |
|
|
Day |
931 |
1,445 |
1,616 |
1,877 |
1,712 |
2,663 |
2,785 |
1,908 |
1,746 |
1,637 |
|
|
% Change |
52.6% |
55.2% |
11.8% |
16.2% |
-8.8% |
55.5% |
4.6% |
-31.5% |
-8.5% |
-6.2% |
|
|
Evening |
2,465 |
2,942 |
3,179 |
4,247 |
4,995 |
4,325 |
3,532 |
3,288 |
3,935 |
1,677 |
|
|
% Change |
228.2% |
19.4% |
8.1% |
33.6% |
17.6% |
-13.4% |
-18.3% |
-6.9% |
19.7% |
-57.4% |
|
|
Total |
3,396 |
4,387 |
4,795 |
6,124 |
6,707 |
6,988 |
6,317 |
5,196 |
5,681 |
3,314 |
|
|
% Change |
149.5% |
29.2% |
9.3% |
27.7% |
9.5% |
4.2% |
-9.6% |
-17.7% |
9.3% |
-41.7% |
|
|
|
|
|
|
|
|
|
|
|
|
|
|
|
Year |
1980 |
1981 |
1982 |
1983 |
1984 |
1985 |
1986 |
1987 |
1988 |
1989 |
|
|
Day |
1,635 |
1,633 |
1,821 |
2,098 |
1,870 |
1,711 |
1,474 |
2,033 |
2,232 |
2,659 |
|
|
% Change |
-0.1% |
-0.1% |
11.5% |
15.2% |
-10.9% |
-8.5% |
-13.9% |
37.9% |
9.8% |
19.1% |
|
|
Evening |
1,672 |
1,578 |
1,403 |
1,631 |
1,342 |
1,421 |
1,149 |
1,596 |
1,632 |
2,021 |
|
|
% Change |
-0.3% |
-5.6% |
-11.1% |
16.3% |
-17.7% |
5.9% |
-19.1% |
38.9% |
2.3% |
23.8% |
|
|
Total |
3,307 |
3,211 |
3,224 |
3,729 |
3,212 |
3,132 |
2,623 |
3,629 |
3,864 |
4,680 |
|
|
% Change |
-0.2% |
-2.9% |
0.4% |
15.7% |
-13.9% |
-2.5% |
-16.3% |
38.4% |
6.5% |
21.1% |
|
|
|
|
|
|
|
|
|
|
|
|
|
|
|
Year |
1990 |
1991 |
1992 |
1993 |
1994 |
1995 |
1996 |
1997 |
1998 |
1999 |
|
|
Day |
3,667 |
3,706 |
4,044 |
3,889 |
3,292 |
2,927 |
3,418 |
3,047 |
3,639 |
3,374 |
|
|
% Change |
37.9% |
1.1% |
9.1% |
-3.8% |
-15.4% |
-11.1% |
16.8% |
-10.9% |
19.4% |
-7.3% |
|
|
Evening |
2,093 |
2,652 |
2,427 |
2,470 |
2,518 |
2,976 |
3,150 |
3,260 |
3,295 |
3,041 |
|
|
% Change |
3.6% |
26.7% |
-8.5% |
1.8% |
1.9% |
18.2% |
5.8% |
3.5% |
1.1% |
-7.7% |
|
|
Total |
5,760 |
6,358 |
6,471 |
6,359 |
5,810 |
5,903 |
6,568 |
6,307 |
6,934 |
6,415 |
|
|
% Change |
23.1% |
10.4% |
1.8% |
-1.7% |
-8.6% |
1.6% |
11.3% |
-4.0% |
9.9% |
-7.5% |
|
|
|
|
|
|
|
|
|
|
|
|
|
|
|
Year |
2000 |
2001 |
2002 |
2003 |
2004 |
2005 |
2006 |
2007 |
2008 |
2009 |
|
|
Day |
3,436 |
3,971 |
4,146 |
5,007 |
4,907 |
5,120 |
5,459 |
5,091 |
0 |
0 |
|
|
% Change |
1.8% |
15.6% |
4.4% |
20.8% |
-2.0% |
4.3% |
6.6% |
-6.7% |
0.0% |
0.0% |
|
|
Evening |
3,157 |
3,371 |
3,359 |
2,867 |
2,788 |
2,435 |
2,303 |
2,408 |
0 |
0 |
|
|
% Change |
3.8% |
6.8% |
-0.4% |
-14.6% |
-2.8% |
-12.7% |
-5.4% |
4.6% |
0.0% |
0.0% |
|
|
Total |
6,593 |
7,342 |
7,505 |
7,874 |
7,695 |
7,555 |
7,762 |
7,499 |
6,413 |
7,099 |
|
|
% Change |
2.8% |
11.4% |
2.2% |
4.9% |
-2.3% |
-1.8% |
2.7% |
-3.4% |
-14.5% |
10.7% |
|
|
|
|
|
|
|
|
|
|
|
|
|
|
|
Year |
2010 |
2011 |
2012 |
2013 |
2014 |
2015 |
2016 |
2017 |
2018 |
|
|
|
Day |
0 |
|
|
|
|
|
|
|
|
|
|
|
% Change |
0.0% |
|
|
|
|
|
|
|
|
|
|
|
Evening |
0 |
|
|
|
|
|
|
|
|
|
|
|
% Change |
0.0% |
|
|
|
|
|
|
|
|
|
|
|
Total |
7,467 |
7,616 |
6,511 |
6,229 |
6,070 |
5,728 |
5,234 |
4,761 |
4,758 |
|
|
|
% Change |
5.2% |
2.0% |
-14.5% |
-4.3% |
-2.6% |
-5.6% |
-8.6% |
-9.0% |
-0.1% |
|
|
|
|
|
|
|
|
|
|
|
|
|
|
|
|
|
|
|
|
|
|
|
|
|
|
|
|
| |
Print in landscape for
best results |
|
|
|
|
|
Last updated on |
May 15, 2018 |
|
| |
Note: A timing difference in data capture for
Spring 2015 resulted in 1 fewer student in this report than the official
number reported to the State. |
|
| |
|
|
|
|
|
|
|
|
|
|
|
|
| |
Source:
Official 45th Day headcount as reported by colleges. |
|
| |
Maricopa Community College District • Office of
Institutional Effectiveness • Maricopa Trends |
|
| |
https://asa.maricopa.edu/departments/institutional-effectiveness/data-and-projects/maricopa-trends |
|
|
|
|
|
|
|
|
|
|
|
|
|
|
|
|
|
|