|
|
|
|
|
|
|
|
|
|
|
|
|
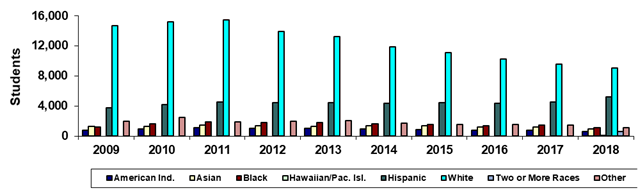
Mesa Community College |
|
Spring 45th Day Ethnicity |
|
|
|
|
|
|
|
|
|
|
|
|
|
|
Year |
2009 |
2010 |
2011 |
2012 |
2013 |
2014 |
2015 |
2016 |
2017 |
2018 |
|
American Ind. |
810 |
983 |
1,140 |
1,053 |
998 |
902 |
875 |
808 |
800 |
606 |
|
Asian |
1,267 |
1,316 |
1,451 |
1,342 |
1,322 |
1,407 |
1,412 |
1,239 |
1,227 |
979 |
|
Black |
1,229 |
1,599 |
1,883 |
1,824 |
1,783 |
1,591 |
1,507 |
1,400 |
1,421 |
1,110 |
|
Hawaiian/Pac. Isl. |
0 |
0 |
0 |
0 |
0 |
0 |
0 |
0 |
0 |
58 |
|
Hispanic |
3,725 |
4,213 |
4,503 |
4,408 |
4,450 |
4,363 |
4,456 |
4,321 |
4,510 |
5,239 |
|
White |
14,707 |
15,237 |
15,485 |
13,934 |
13,193 |
11,885 |
11,093 |
10,241 |
9,567 |
9,017 |
|
Two or More Races |
0 |
0 |
0 |
0 |
0 |
0 |
0 |
0 |
0 |
607 |
|
Other |
1,934 |
2,491 |
1,905 |
1,945 |
2,043 |
1,730 |
1,499 |
1,505 |
1,488 |
1,157 |
|
Total |
23,672 |
25,839 |
26,367 |
24,506 |
23,789 |
21,878 |
20,842 |
19,514 |
19,013 |
18,773 |
|
|
|
|
|
|
|
|
|
|
|
|
|
% American Ind. |
3.4% |
3.8% |
4.3% |
4.3% |
4.2% |
4.1% |
4.2% |
4.1% |
4.2% |
3.2% |
|
% Asian |
5.4% |
5.1% |
5.5% |
5.5% |
5.6% |
6.4% |
6.8% |
6.3% |
6.5% |
5.2% |
|
% Black |
5.2% |
6.2% |
7.1% |
7.4% |
7.5% |
7.3% |
7.2% |
7.2% |
7.5% |
5.9% |
|
% Hawaiian/Pac. Isl. |
0.0% |
0.0% |
0.0% |
0.0% |
0.0% |
0.0% |
0.0% |
0.0% |
0.0% |
0.3% |
|
% Hispanic |
15.7% |
16.3% |
17.1% |
18.0% |
18.7% |
19.9% |
21.4% |
22.1% |
23.7% |
27.9% |
|
% White |
62.1% |
59.0% |
58.7% |
56.9% |
55.5% |
54.3% |
53.2% |
52.5% |
50.3% |
48.0% |
|
% Two or More Races |
0.0% |
0.0% |
0.0% |
0.0% |
0.0% |
0.0% |
0.0% |
0.0% |
0.0% |
3.2% |
|
% Other |
8.2% |
9.6% |
7.2% |
7.9% |
8.6% |
7.9% |
7.2% |
7.7% |
7.8% |
6.2% |
|
|
|
|
|
|
|
|
|
|
|
|
|
Print in landscape for
best results |
|
|
|
|
|
Last updated on |
May 15, 2018 |
|
Note: A timing difference in data capture for
Spring 2015 resulted in 1 fewer student in this report than the official
number reported to the State. |
|
|
|
|
|
|
|
|
|
|
|
|
|
Source:
Official 45th Day headcount as reported by colleges. |
|
Maricopa Community College District • Office of
Institutional Effectiveness • Maricopa Trends |
|
https://asa.maricopa.edu/departments/institutional-effectiveness/data-and-projects/maricopa-trends |
|
|
|
|
*Beginning in Spring
2018, race-ethnicity categories changed to provide counts for
"Hawaiian/Pacific Islander" and "Two or more races." |
|
|
|
|
|
|
|
|
|
|
|
|