|
|
|
|
|
|
|
|
|
|
|
|
|
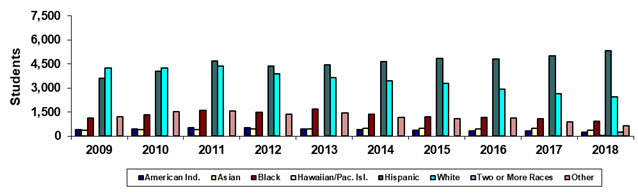
Phoenix College |
|
Spring 45th Day Ethnicity |
|
|
|
|
|
|
|
|
|
|
|
|
|
|
Year |
2009 |
2010 |
2011 |
2012 |
2013 |
2014 |
2015 |
2016 |
2017 |
2018 |
|
American Ind. |
420 |
443 |
526 |
513 |
450 |
385 |
343 |
309 |
327 |
246 |
|
Asian |
362 |
405 |
420 |
439 |
442 |
471 |
463 |
433 |
470 |
381 |
|
Black |
1,120 |
1,321 |
1,619 |
1,487 |
1,682 |
1,349 |
1,212 |
1,168 |
1,086 |
925 |
|
Hawaiian/Pac. Isl. |
0 |
0 |
0 |
0 |
0 |
0 |
0 |
0 |
0 |
19 |
|
Hispanic |
3,586 |
4,044 |
4,673 |
4,378 |
4,441 |
4,648 |
4,856 |
4,810 |
4,988 |
5,340 |
|
White |
4,243 |
4,257 |
4,369 |
3,869 |
3,625 |
3,445 |
3,276 |
2,932 |
2,656 |
2,450 |
|
Two or More Races |
0 |
0 |
0 |
0 |
0 |
0 |
0 |
0 |
0 |
229 |
|
Other |
1,211 |
1,522 |
1,579 |
1,348 |
1,429 |
1,160 |
1,089 |
1,123 |
895 |
648 |
|
Total |
10,942 |
11,992 |
13,186 |
12,034 |
12,069 |
11,458 |
11,239 |
10,775 |
10,422 |
10,238 |
|
|
|
|
|
|
|
|
|
|
|
|
|
% American Ind. |
3.8% |
3.7% |
4.0% |
4.3% |
3.7% |
3.4% |
3.1% |
2.9% |
3.1% |
2.4% |
|
% Asian |
3.3% |
3.4% |
3.2% |
3.6% |
3.7% |
4.1% |
4.1% |
4.0% |
4.5% |
3.7% |
|
% Black |
10.2% |
11.0% |
12.3% |
12.4% |
13.9% |
11.8% |
10.8% |
10.8% |
10.4% |
9.0% |
|
% Hawaiian/Pac. Isl. |
0.0% |
0.0% |
0.0% |
0.0% |
0.0% |
0.0% |
0.0% |
0.0% |
0.0% |
0.2% |
|
% Hispanic |
32.8% |
33.7% |
35.4% |
36.4% |
36.8% |
40.6% |
43.2% |
44.6% |
47.9% |
52.2% |
|
% White |
38.8% |
35.5% |
33.1% |
32.2% |
30.0% |
30.1% |
29.1% |
27.2% |
25.5% |
23.9% |
|
% Two or More Races |
0.0% |
0.0% |
0.0% |
0.0% |
0.0% |
0.0% |
0.0% |
0.0% |
0.0% |
2.2% |
|
% Other |
11.1% |
12.7% |
12.0% |
11.2% |
11.8% |
10.1% |
9.7% |
10.4% |
8.6% |
6.3% |
|
|
|
|
|
|
|
|
|
|
|
|
|
Print in landscape for
best results |
|
|
|
|
|
Last updated on |
May 15, 2018 |
|
Note: A timing difference in data capture for
Spring 2015 resulted in 2 fewer students in this report than the official
number reported to the State. |
|
|
|
|
|
|
|
|
|
|
|
|
|
Source:
Official 45th Day headcount as reported by colleges. |
|
Maricopa Community College District • Office of
Institutional Effectiveness • Maricopa Trends |
|
https://asa.maricopa.edu/departments/institutional-effectiveness/data-and-projects/maricopa-trends |
|
|
|
|
*Beginning in Spring
2018, race-ethnicity categories changed to provide counts for
"Hawaiian/Pacific Islander" and "Two or more races." |
|
|
|
|
|
|
|
|
|
|
|
|