|
|
|
|
|
|
|
|
|
|
|
|
|
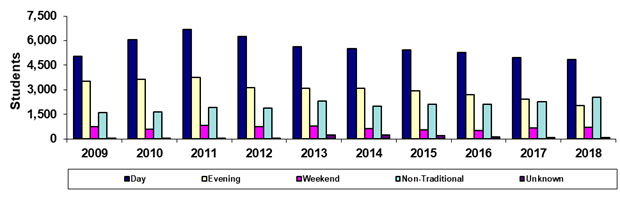
Phoenix College |
|
Spring 45th Day Primary Time of Attendance
Headcount |
|
|
|
|
|
|
|
|
|
|
|
|
|
|
Year |
2009 |
2010 |
2011 |
2012 |
2013 |
2014 |
2015 |
2016 |
2017 |
2018 |
|
Day |
5,049 |
6,065 |
6,666 |
6,239 |
5,636 |
5,513 |
5,429 |
5,258 |
4,944 |
4,860 |
|
Evening |
3,516 |
3,644 |
3,766 |
3,117 |
3,108 |
3,077 |
2,935 |
2,717 |
2,443 |
2,030 |
|
Weekend |
759 |
606 |
829 |
757 |
771 |
640 |
561 |
532 |
663 |
698 |
|
Non-Traditional |
1,615 |
1,663 |
1,923 |
1,868 |
2,315 |
1,989 |
2,123 |
2,133 |
2,287 |
2,561 |
|
Unknown |
3 |
14 |
2 |
53 |
239 |
239 |
191 |
135 |
85 |
89 |
|
Total |
10,942 |
11,992 |
13,186 |
12,034 |
12,069 |
11,458 |
11,239 |
10,775 |
10,422 |
10,238 |
|
|
|
|
|
|
|
|
|
|
|
|
|
% Day |
46.1% |
50.6% |
50.6% |
51.8% |
46.7% |
48.1% |
48.3% |
48.8% |
47.4% |
47.5% |
|
% Evening |
32.1% |
30.4% |
28.6% |
25.9% |
25.8% |
26.9% |
26.1% |
25.2% |
23.4% |
19.8% |
|
%Weekend |
6.9% |
5.1% |
6.3% |
6.3% |
6.4% |
5.6% |
5.0% |
4.9% |
6.4% |
6.8% |
|
%Non-Traditional |
14.8% |
13.9% |
14.6% |
15.5% |
19.2% |
17.4% |
18.9% |
19.8% |
21.9% |
25.0% |
|
%Unknown |
0.0% |
0.1% |
0.0% |
0.4% |
2.0% |
2.1% |
1.7% |
1.3% |
0.8% |
0.9% |
|
|
|
|
|
|
|
|
|
|
|
|
| |
Print in landscape for
best results |
|
|
|
|
|
Last updated on |
May 15, 2018 |
| |
Note: A timing difference in data capture for
Spring 2015 resulted in 2 fewer students in this report than the official
number reported to the State. |
| |
|
|
|
|
|
|
|
|
|
|
|
| |
Source:
Official 45th Day headcount as reported by colleges. |
| |
Maricopa Community College District • Office of
Institutional Effectiveness • Maricopa Trends |
| |
https://asa.maricopa.edu/departments/institutional-effectiveness/data-and-projects/maricopa-trends |
|
|
|
|
|
|
|
|
|
|
|
|
|
|