|
|
|
|
|
|
|
|
|
|
|
|
|
|
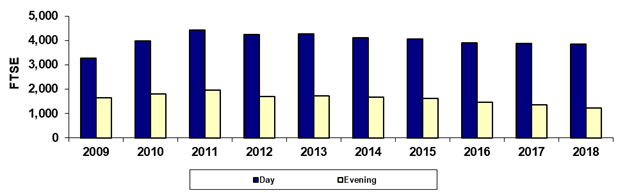
Phoenix College |
|
|
Spring 45th Day Day/Evening FTSE |
|
|
|
|
|
|
|
|
|
|
|
|
|
|
|
|
|
|
|
|
|
|
|
|
|
|
|
|
|
|
|
|
|
|
|
|
|
|
|
|
|
|
|
|
|
|
|
|
|
|
|
|
|
|
|
|
|
|
|
|
|
|
|
|
|
|
|
|
|
|
|
|
|
|
|
|
|
|
|
|
|
|
|
|
|
|
|
|
|
|
|
|
|
|
|
|
|
|
|
|
|
|
|
|
|
|
|
|
|
|
|
|
|
|
|
|
|
|
|
|
|
|
|
|
|
|
|
|
|
|
|
|
|
|
|
|
|
|
|
|
|
|
|
|
|
|
|
|
|
|
|
|
|
|
|
|
|
|
Year |
2009 |
2010 |
2011 |
2012 |
2013 |
2014 |
2015 |
2016 |
2017 |
2018 |
|
|
Day |
3,273.3 |
3,964.7 |
4,422.0 |
4,251.2 |
4,266.6 |
4,121.0 |
4,047.5 |
3,891.9 |
3,875.8 |
3,854.6 |
|
|
Evening |
1,653.5 |
1,799.2 |
1,961.5 |
1,703.9 |
1,714.8 |
1,671.4 |
1,618.3 |
1,469.4 |
1,359.7 |
1,219.1 |
|
|
Total |
4,926.8 |
5,763.9 |
6,383.4 |
5,955.2 |
5,981.4 |
5,792.4 |
5,665.7 |
5,361.2 |
5,235.5 |
5,073.8 |
|
|
|
|
|
|
|
|
|
|
|
|
|
|
|
% Day |
66.4% |
68.8% |
69.3% |
71.4% |
71.3% |
71.1% |
71.4% |
72.6% |
74.0% |
76.0% |
|
|
% Evening |
33.6% |
31.2% |
30.7% |
28.6% |
28.7% |
28.9% |
28.6% |
27.4% |
26.0% |
24.0% |
|
|
|
|
|
|
|
|
|
|
|
|
|
|
|
Due to rounding, the sum
of the numbers may not equal the Total. |
|
|
Last updated on |
May 15, 2018 |
|
|
Print in landscape for best results |
|
|
|
|
Source:
Official 45th Day FTSE numbers as reported by the colleges after
manual adjustments (unaudited). |
|
|
Maricopa Community College District • Office of
Institutional Effectiveness • Maricopa Trends • www.maricopa.edu/academic/ir |
|
|
|
|
|
|
|
|
|
|
|
|
|
|