|
|
|
|
|
|
|
|
|
|
|
|
|
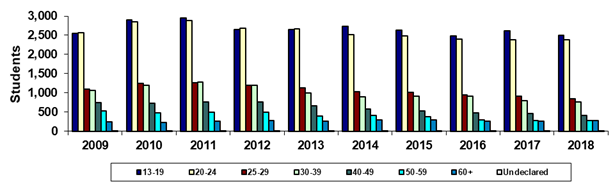
Paradise Valley Community College |
|
Spring 45th Day Age Groups |
|
|
|
|
|
|
|
|
|
|
|
|
|
|
|
|
|
|
|
|
|
|
|
|
|
Year |
2009 |
2010 |
2011 |
2012 |
2013 |
2014 |
2015 |
2016 |
2017 |
2018 |
|
13-19 |
2,542 |
2,900 |
2,955 |
2,645 |
2,649 |
2,731 |
2,634 |
2,475 |
2,618 |
2,496 |
|
20-24 |
2,558 |
2,842 |
2,885 |
2,691 |
2,673 |
2,510 |
2,485 |
2,405 |
2,376 |
2,384 |
|
25-29 |
1,100 |
1,252 |
1,261 |
1,194 |
1,133 |
1,022 |
1,007 |
945 |
906 |
846 |
|
30-39 |
1,063 |
1,196 |
1,288 |
1,190 |
1,004 |
898 |
917 |
907 |
800 |
769 |
|
40-49 |
740 |
737 |
764 |
756 |
665 |
578 |
532 |
479 |
461 |
417 |
|
50-59 |
532 |
472 |
488 |
490 |
394 |
410 |
373 |
302 |
282 |
286 |
|
60+ |
251 |
232 |
270 |
273 |
256 |
299 |
288 |
262 |
262 |
285 |
|
Undeclared |
18 |
8 |
7 |
5 |
6 |
4 |
4 |
3 |
4 |
3 |
|
Total |
8,804 |
9,639 |
9,918 |
9,244 |
8,780 |
8,452 |
8,240 |
7,778 |
7,709 |
7,486 |
|
|
|
|
|
|
|
|
|
|
|
|
|
% 13-19 |
28.9% |
30.1% |
29.8% |
28.6% |
30.2% |
32.3% |
32.0% |
31.8% |
34.0% |
33.3% |
|
% 20-24 |
29.1% |
29.5% |
29.1% |
29.1% |
30.4% |
29.7% |
30.2% |
30.9% |
30.8% |
31.8% |
|
% 25-29 |
12.5% |
13.0% |
12.7% |
12.9% |
12.9% |
12.1% |
12.2% |
12.1% |
11.8% |
11.3% |
|
% 30-39 |
12.1% |
12.4% |
13.0% |
12.9% |
11.4% |
10.6% |
11.1% |
11.7% |
10.4% |
10.3% |
|
% 40-49 |
8.4% |
7.6% |
7.7% |
8.2% |
7.6% |
6.8% |
6.5% |
6.2% |
6.0% |
5.6% |
|
% 50-59 |
6.0% |
4.9% |
4.9% |
5.3% |
4.5% |
4.9% |
4.5% |
3.9% |
3.7% |
3.8% |
|
% 60+ |
2.9% |
2.4% |
2.7% |
3.0% |
2.9% |
3.5% |
3.5% |
3.4% |
3.4% |
3.8% |
|
% Undeclared |
0.2% |
0.1% |
0.1% |
0.1% |
0.1% |
0.0% |
0.0% |
0.0% |
0.1% |
0.0% |
|
|
|
|
|
|
|
|
|
|
|
|
|
Print in landscape for
best results |
|
|
|
|
|
Last updated on |
May 15, 2018 |
|
Source:
Official 45th Day headcount as reported by colleges. |
|
Maricopa Community College District • Office of
Institutional Effectiveness • Maricopa Trends |
|
https://asa.maricopa.edu/departments/institutional-effectiveness/data-and-projects/maricopa-trends |
|
|
|
|
|
|
|
|
|
|
|
|
|
|