|
|
|
|
|
|
|
|
|
|
|
|
|
Paradise Valley Community College |
|
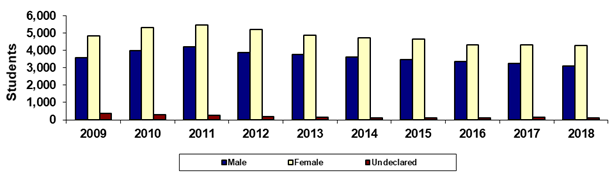
Spring 45th Day Gender |
|
|
|
|
|
|
|
|
|
|
|
|
|
|
|
|
|
|
|
|
|
|
|
|
|
Year |
2009 |
2010 |
2011 |
2012 |
2013 |
2014 |
2015 |
2016 |
2017 |
2018 |
|
Male |
3,584 |
4,007 |
4,218 |
3,878 |
3,772 |
3,620 |
3,481 |
3,348 |
3,239 |
3,091 |
|
Female |
4,856 |
5,316 |
5,449 |
5,197 |
4,869 |
4,719 |
4,659 |
4,324 |
4,337 |
4,268 |
|
Undeclared |
364 |
316 |
251 |
169 |
139 |
113 |
100 |
106 |
133 |
127 |
|
Total |
8,804 |
9,639 |
9,918 |
9,244 |
8,780 |
8,452 |
8,240 |
7,778 |
7,709 |
7,486 |
|
|
|
% Male |
40.7% |
41.6% |
42.5% |
42.0% |
43.0% |
42.8% |
42.2% |
43.0% |
42.0% |
41.3% |
|
% Female |
55.2% |
55.2% |
54.9% |
56.2% |
55.5% |
55.8% |
56.5% |
55.6% |
56.3% |
57.0% |
|
% Undeclared |
4.1% |
3.3% |
2.5% |
1.8% |
1.6% |
1.3% |
1.2% |
1.4% |
1.7% |
1.7% |
|
|
|
|
|
|
|
|
|
|
|
|
|
Print in landscape for
best results |
|
|
|
|
|
Last updated on |
May 15, 2018 |
|
Source:
Official 45th Day headcount as reported by colleges. |
|
Maricopa Community College District • Office of
Institutional Effectiveness • Maricopa Trends |
|
https://asa.maricopa.edu/departments/institutional-effectiveness/data-and-projects/maricopa-trends |
|
|
|
|
|
|
|
|
|
|
|
|
|
|