|
|
|
|
|
|
|
|
|
|
|
|
|
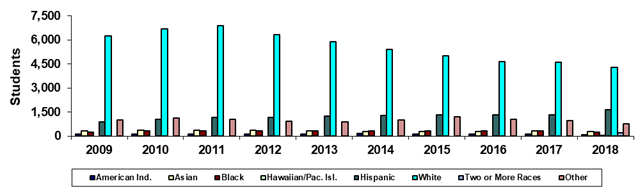
Paradise Valley Community College |
|
Spring 45th Day Ethnicity |
|
|
|
|
|
|
|
|
|
|
|
|
|
|
Year |
2009 |
2010 |
2011 |
2012 |
2013 |
2014 |
2015 |
2016 |
2017 |
2018 |
|
American Ind. |
120 |
132 |
139 |
140 |
135 |
146 |
116 |
120 |
126 |
90 |
|
Asian |
319 |
363 |
374 |
346 |
305 |
300 |
289 |
297 |
321 |
263 |
|
Black |
231 |
303 |
325 |
340 |
339 |
313 |
312 |
333 |
341 |
258 |
|
Hawaiian/Pac. Isl. |
0 |
0 |
0 |
0 |
0 |
0 |
0 |
0 |
0 |
8 |
|
Hispanic |
894 |
1,045 |
1,153 |
1,167 |
1,233 |
1,282 |
1,313 |
1,313 |
1,342 |
1,644 |
|
White |
6,240 |
6,678 |
6,871 |
6,320 |
5,891 |
5,402 |
5,012 |
4,657 |
4,617 |
4,289 |
|
Two or More Races |
0 |
0 |
0 |
0 |
0 |
0 |
0 |
0 |
0 |
189 |
|
Other |
1,000 |
1,118 |
1,056 |
931 |
877 |
1,009 |
1,198 |
1,058 |
962 |
745 |
|
Total |
8,804 |
9,639 |
9,918 |
9,244 |
8,780 |
8,452 |
8,240 |
7,778 |
7,709 |
7,486 |
|
|
|
|
|
|
|
|
|
|
|
|
|
% American Ind. |
1.4% |
1.4% |
1.4% |
1.5% |
1.5% |
1.7% |
1.4% |
1.5% |
1.6% |
1.2% |
|
% Asian |
3.6% |
3.8% |
3.8% |
3.7% |
3.5% |
3.5% |
3.5% |
3.8% |
4.2% |
3.5% |
|
% Black |
2.6% |
3.1% |
3.3% |
3.7% |
3.9% |
3.7% |
3.8% |
4.3% |
4.4% |
3.4% |
|
% Hawaiian/Pac. Isl. |
0.0% |
0.0% |
0.0% |
0.0% |
0.0% |
0.0% |
0.0% |
0.0% |
0.0% |
0.1% |
|
% Hispanic |
10.2% |
10.8% |
11.6% |
12.6% |
14.0% |
15.2% |
15.9% |
16.9% |
17.4% |
22.0% |
|
% White |
70.9% |
69.3% |
69.3% |
68.4% |
67.1% |
63.9% |
60.8% |
59.9% |
59.9% |
57.3% |
|
% Two or More Races |
0.0% |
0.0% |
0.0% |
0.0% |
0.0% |
0.0% |
0.0% |
0.0% |
0.0% |
2.5% |
|
% Other |
11.4% |
11.6% |
10.6% |
10.1% |
10.0% |
11.9% |
14.5% |
13.6% |
12.5% |
10.0% |
|
|
|
|
|
|
|
|
|
|
|
|
|
Print in landscape for
best results |
|
|
|
|
|
Last updated on |
May 15, 2018 |
|
Source:
Official 45th Day headcount as reported by colleges. |
|
Maricopa Community College District • Office of
Institutional Effectiveness • Maricopa Trends |
|
https://asa.maricopa.edu/departments/institutional-effectiveness/data-and-projects/maricopa-trends |
|
|
|
|
*Beginning in Spring
2018, race-ethnicity categories changed to provide counts for
"Hawaiian/Pacific Islander" and "Two or more races." |
|
|
|
|
|
|
|
|
|
|
|
|