|
|
|
|
|
|
|
|
|
|
|
|
|
|
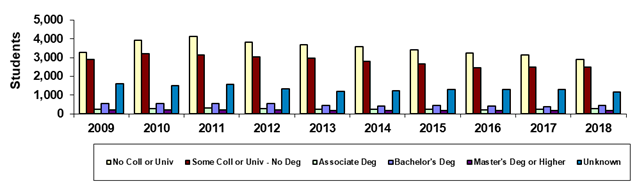
Paradise Valley Community College |
|
|
Spring 45th Day Admission Status |
|
|
|
|
|
|
|
|
|
|
|
|
|
|
|
|
|
|
|
|
|
|
|
|
|
|
|
|
|
|
|
|
|
|
|
|
|
|
|
|
|
|
|
|
|
|
|
|
|
|
|
|
|
|
|
|
|
|
|
|
|
|
|
|
|
|
|
|
|
|
|
|
|
|
|
|
|
|
|
|
|
|
|
|
|
|
|
|
|
|
|
|
|
|
|
|
|
|
|
|
|
|
|
|
|
|
|
|
|
|
|
|
|
|
|
|
|
|
|
|
|
|
|
|
|
|
|
|
|
|
|
|
|
|
|
|
|
|
|
|
|
|
|
|
|
|
|
|
|
|
|
|
|
|
|
|
|
|
Year |
2009 |
2010 |
2011 |
2012 |
2013 |
2014 |
2015 |
2016 |
2017 |
2018 |
|
|
No Coll or Univ |
3,291 |
3,910 |
4,132 |
3,824 |
3,700 |
3,576 |
3,426 |
3,253 |
3,142 |
2,913 |
|
|
Some Coll or Univ - No Deg |
2,896 |
3,191 |
3,138 |
3,034 |
2,985 |
2,797 |
2,674 |
2,457 |
2,475 |
2,498 |
|
|
Associate Deg |
256 |
275 |
304 |
287 |
241 |
238 |
228 |
206 |
234 |
264 |
|
|
Bachelor's Deg |
536 |
555 |
562 |
542 |
465 |
419 |
438 |
401 |
396 |
455 |
|
|
Master's Deg or Higher |
202 |
205 |
213 |
218 |
183 |
182 |
177 |
164 |
174 |
193 |
|
|
Unknown |
1,623 |
1,503 |
1,569 |
1,339 |
1,206 |
1,240 |
1,297 |
1,297 |
1,288 |
1,163 |
|
|
Total |
8,804 |
9,639 |
9,918 |
9,244 |
8,780 |
8,452 |
8,240 |
7,778 |
7,709 |
7,486 |
|
|
|
|
|
|
|
|
|
|
|
|
|
|
|
|
|
|
|
|
|
|
|
|
|
|
|
|
% No Coll or Univ |
37.4% |
40.6% |
41.7% |
41.4% |
42.1% |
42.3% |
41.6% |
41.8% |
40.8% |
38.9% |
|
|
% Some Coll or Univ - No Deg |
32.9% |
33.1% |
31.6% |
32.8% |
34.0% |
33.1% |
32.5% |
31.6% |
32.1% |
33.4% |
|
|
% Associate Deg |
2.9% |
2.9% |
3.1% |
3.1% |
2.7% |
2.8% |
2.8% |
2.6% |
3.0% |
3.5% |
|
|
% Bachelor's Deg |
6.1% |
5.8% |
5.7% |
5.9% |
5.3% |
5.0% |
5.3% |
5.2% |
5.1% |
6.1% |
|
|
% Master's Deg or Higher |
2.3% |
2.1% |
2.1% |
2.4% |
2.1% |
2.2% |
2.1% |
2.1% |
2.3% |
2.6% |
|
|
% Unknown |
18.4% |
15.6% |
15.8% |
14.5% |
13.7% |
14.7% |
15.7% |
16.7% |
16.7% |
15.5% |
|
|
|
|
|
|
|
|
|
|
|
|
|
|
| |
Print in landscape for best results |
|
|
|
|
|
|
Last updated on |
May 15, 2018 |
|
| |
Source:
Official 45th Day headcount as reported by colleges. |
|
| |
Maricopa Community College District • Office of
Institutional Effectiveness • Maricopa Trends |
|
| |
https://asa.maricopa.edu/departments/institutional-effectiveness/data-and-projects/maricopa-trends |
|
|
|
|
|
|
|
|
|
|
|
|
|
|
|
|
|