|
|
|
|
|
|
|
|
|
|
|
|
|
|
|
|
|
|
|
|
|
|
|
|
|
|
|
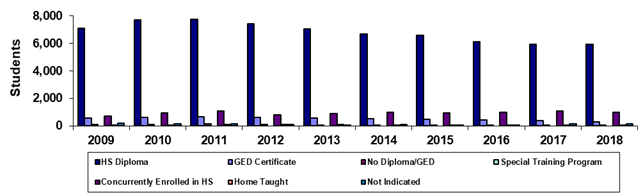
Paradise Valley Community College |
|
|
|
Spring 45th Day High School Status |
|
|
|
|
|
|
|
|
|
|
|
|
|
|
|
|
|
|
|
|
|
|
|
|
|
|
|
|
|
|
|
|
|
|
|
|
|
|
|
|
|
|
|
|
|
|
|
|
|
|
|
|
|
|
|
|
|
|
|
|
|
|
|
|
|
|
|
|
|
|
|
|
|
|
|
|
|
|
|
|
|
|
|
|
|
|
|
|
|
|
|
|
|
|
|
|
|
|
|
|
|
|
|
|
|
|
|
|
|
|
|
|
|
|
|
|
|
|
|
|
|
|
|
|
|
|
|
|
|
|
|
|
|
|
|
|
|
|
|
|
|
|
|
|
|
|
|
|
|
|
|
|
|
|
|
|
|
|
|
|
|
|
|
|
|
|
|
|
|
|
|
Year |
2009 |
2010 |
2011 |
2012 |
2013 |
2014 |
2015 |
2016 |
2017 |
2018 |
|
|
|
HS Diploma |
7,081 |
7,702 |
7,758 |
7,444 |
7,047 |
6,671 |
6,569 |
6,121 |
5,953 |
5,947 |
|
|
|
GED Certificate |
570 |
616 |
667 |
648 |
556 |
534 |
475 |
430 |
382 |
307 |
|
|
|
No Diploma/GED |
131 |
125 |
137 |
115 |
87 |
75 |
56 |
52 |
64 |
41 |
|
|
|
Special Training Program |
0 |
0 |
0 |
0 |
0 |
0 |
0 |
0 |
0 |
0 |
|
|
|
Concurrently Enrolled in HS |
729 |
955 |
1,092 |
821 |
898 |
991 |
971 |
1,004 |
1,086 |
980 |
|
|
|
Home Taught |
69 |
66 |
97 |
92 |
102 |
89 |
87 |
81 |
80 |
73 |
|
|
|
Not Indicated |
224 |
175 |
167 |
124 |
90 |
92 |
82 |
90 |
144 |
138 |
|
|
|
Total |
8,804 |
9,639 |
9,918 |
9,244 |
8,780 |
8,452 |
8,240 |
7,778 |
7,709 |
7,486 |
|
|
|
|
|
|
|
|
|
|
|
|
|
|
|
|
|
%HS Diploma |
80.4% |
79.9% |
78.2% |
80.5% |
80.3% |
78.9% |
79.7% |
78.7% |
77.2% |
79.4% |
|
|
|
%GED Certificate |
6.5% |
6.4% |
6.7% |
7.0% |
6.3% |
6.3% |
5.8% |
5.5% |
5.0% |
4.1% |
|
|
|
%No Diploma/GED |
1.5% |
1.3% |
1.4% |
1.2% |
1.0% |
0.9% |
0.7% |
0.7% |
0.8% |
0.5% |
|
|
|
%Special Training Program |
0.0% |
0.0% |
0.0% |
0.0% |
0.0% |
0.0% |
0.0% |
0.0% |
0.0% |
0.0% |
|
|
|
%Concurrently Enrolled in HS |
8.3% |
9.9% |
11.0% |
8.9% |
10.2% |
11.7% |
11.8% |
12.9% |
14.1% |
13.1% |
|
|
|
%Home Taught |
0.8% |
0.7% |
1.0% |
1.0% |
1.2% |
1.1% |
1.1% |
1.0% |
1.0% |
1.0% |
|
|
|
%Not Indicated |
2.5% |
1.8% |
1.7% |
1.3% |
1.0% |
1.1% |
1.0% |
1.2% |
1.9% |
1.8% |
|
|
|
|
|
|
|
|
|
|
|
|
|
|
|
|
|
Print in landscape for best results |
|
|
|
|
|
|
Last updated on |
May 15, 2018 |
|
|
|
|
|
|
|
|
|
|
|
|
|
|
|
Source:
Official 45th Day headcount as reported by colleges. |
|
|
|
|
|
|
|
|
|
|
|
|
|
|
|
Maricopa Community College District • Office of
Institutional Effectiveness • Maricopa Trends |
|
|
|
|
|
|
|
|
|
|
|
|
|
|
|
https://asa.maricopa.edu/departments/institutional-effectiveness/data-and-projects/maricopa-trends |
|
|
|
|
|
|
|
|
|
|
|
|
|
|
|
|
|
|
|
|
|
|
|
|
|
|
|
|
|
|
|
|
|
|
|
|
|
|
|
|
|
|
|