|
|
|
|
|
|
|
|
|
|
|
|
|
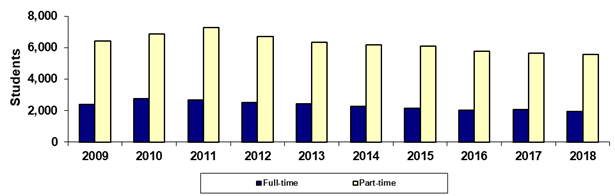
Paradise Valley Community College |
|
Spring 45th Day Full-time vs Part-time |
|
|
|
|
|
|
|
|
|
|
|
|
|
|
Year |
2009 |
2010 |
2011 |
2012 |
2013 |
2014 |
2015 |
2016 |
2017 |
2018 |
|
Full-time |
2,381 |
2,776 |
2,659 |
2,526 |
2,450 |
2,281 |
2,155 |
2,023 |
2,060 |
1,935 |
|
Part-time |
6,423 |
6,863 |
7,259 |
6,718 |
6,330 |
6,171 |
6,085 |
5,755 |
5,649 |
5,551 |
|
Sum of Colleges* |
8,804 |
9,639 |
9,918 |
9,244 |
8,780 |
8,452 |
8,240 |
7,778 |
7,709 |
7,486 |
|
|
|
|
|
|
|
|
|
|
|
|
|
% Full-time |
27.0% |
28.8% |
26.8% |
27.3% |
27.9% |
27.0% |
26.2% |
26.0% |
26.7% |
25.8% |
|
% Part-time |
73.0% |
71.2% |
73.2% |
72.7% |
72.1% |
73.0% |
73.8% |
74.0% |
73.3% |
74.2% |
|
|
|
|
|
|
|
|
|
|
|
|
|
Print in landscape for
best results |
|
|
|
|
|
Last updated on |
May 15, 2018 |
|
Source:
Official 45th Day headcount as reported by colleges. |
|
Maricopa Community College District • Office of
Institutional Effectiveness • Maricopa Trends |
|
https://asa.maricopa.edu/departments/institutional-effectiveness/data-and-projects/maricopa-trends |
|
|
|
|
|
|
|
|
|
|
|
|
|
|
|
|
|
|
|
|
|
|
|
|
|
|
|
|
|
|
|
|
|
|
|
|
|
|
|
|
|
|
|
|
|
|
|
|
|
|
|
|
|
|
|
|
|
|
|
|
|
|
|
|
|
|
|
|
|
|
|
|
|
|
|
|
|
|
|
|
|
|
|
|
|
|
|
|
|
|
|
|
|
|
|
|
|
|
|
|
|
|
|
|
|
|
|
|
|
|
|
|
|
|
|
|
|
|
|
|
|
|
|
|
|
|
|
|
|
|
|
|
|
|
|
|
|
|
|
|
|
|
|
|
|
|
|
|
|
|
|
|
|
|
|
|
|
|
|
|
|
|
|
|
|
|
|
|
|
|