|
|
|
|
|
|
|
|
|
|
|
|
|
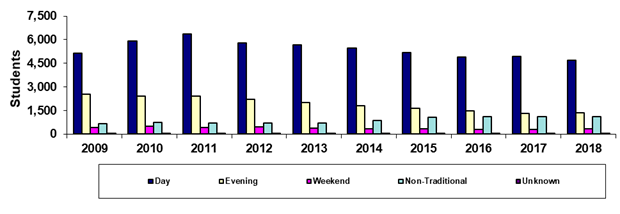
Paradise Valley Community College |
|
Spring 45th Day Primary Time of Attendance
Headcount |
|
|
|
|
|
|
|
|
|
|
|
|
|
|
Year |
2009 |
2010 |
2011 |
2012 |
2013 |
2014 |
2015 |
2016 |
2017 |
2018 |
|
Day |
5,122 |
5,925 |
6,343 |
5,789 |
5,667 |
5,452 |
5,192 |
4,893 |
4,923 |
4,673 |
|
Evening |
2,531 |
2,404 |
2,412 |
2,230 |
1,994 |
1,786 |
1,628 |
1,473 |
1,335 |
1,338 |
|
Weekend |
409 |
494 |
420 |
463 |
378 |
335 |
327 |
301 |
298 |
349 |
|
Non-Traditional |
685 |
760 |
703 |
726 |
714 |
869 |
1,082 |
1,094 |
1,096 |
1,108 |
|
Unknown |
57 |
56 |
40 |
36 |
27 |
10 |
11 |
17 |
57 |
18 |
|
Total |
8,804 |
9,639 |
9,918 |
9,244 |
8,780 |
8,452 |
8,240 |
7,778 |
7,709 |
7,486 |
|
|
|
|
|
|
|
|
|
|
|
|
|
% Day |
58.2% |
61.5% |
64.0% |
62.6% |
64.5% |
64.5% |
63.0% |
62.9% |
63.9% |
62.4% |
|
% Evening |
28.7% |
24.9% |
24.3% |
24.1% |
22.7% |
21.1% |
19.8% |
18.9% |
17.3% |
17.9% |
|
%Weekend |
4.6% |
5.1% |
4.2% |
5.0% |
4.3% |
4.0% |
4.0% |
3.9% |
3.9% |
4.7% |
|
%Non-Traditional |
7.8% |
7.9% |
7.1% |
7.9% |
8.1% |
10.3% |
13.1% |
14.1% |
14.2% |
14.8% |
|
%Unknown |
0.6% |
0.6% |
0.4% |
0.4% |
0.3% |
0.1% |
0.1% |
0.2% |
0.7% |
0.2% |
|
|
|
|
|
|
|
|
|
|
|
|
|
Print in landscape for
best results |
|
|
|
|
|
Last updated on |
May 15, 2018 |
|
Source:
Official 45th Day headcount as reported by colleges. |
|
Maricopa Community College District • Office of
Institutional Effectiveness • Maricopa Trends |
|
https://asa.maricopa.edu/departments/institutional-effectiveness/data-and-projects/maricopa-trends |
|
|
|
|
|
|
|
|
|
|
|
|
|
|