|
|
|
|
|
|
|
|
|
|
|
|
|
|
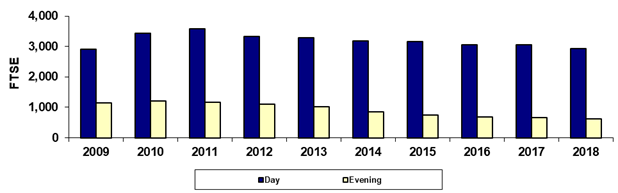
Paradise Valley Community College |
|
|
Spring 45th Day Day/Evening FTSE |
|
|
|
|
|
|
|
|
|
|
|
|
|
|
|
|
|
|
|
|
|
|
|
|
|
|
|
|
|
|
|
|
|
|
|
|
|
|
|
|
|
|
|
|
|
|
|
|
|
|
|
|
|
|
|
|
|
|
|
|
|
|
|
|
|
|
|
|
|
|
|
|
|
|
|
|
|
|
|
|
|
|
|
|
|
|
|
|
|
|
|
|
|
|
|
|
|
|
|
|
|
|
|
|
|
|
|
|
|
|
|
|
|
|
|
|
|
|
|
|
|
|
|
|
|
|
|
|
|
|
|
|
|
|
|
|
|
|
|
|
|
|
|
|
|
|
|
|
|
|
|
|
|
|
|
|
|
|
Year |
2009 |
2010 |
2011 |
2012 |
2013 |
2014 |
2015 |
2016 |
2017 |
2018 |
|
|
Day |
2,910.8 |
3,428.8 |
3,590.7 |
3,323.1 |
3,282.7 |
3,185.8 |
3,164.0 |
3,056.8 |
3,064.1 |
2,921.5 |
|
|
Evening |
1,138.5 |
1,213.2 |
1,159.7 |
1,101.4 |
1,020.0 |
858.2 |
756.5 |
685.3 |
658.7 |
612.9 |
|
|
Total |
4,049.3 |
4,642.0 |
4,750.4 |
4,424.5 |
4,302.7 |
4,044.0 |
3,920.6 |
3,742.0 |
3,722.8 |
3,534.4 |
|
|
|
|
|
|
|
|
|
|
|
|
|
|
|
% Day |
71.9% |
73.9% |
75.6% |
75.1% |
76.3% |
78.8% |
80.7% |
81.7% |
82.3% |
82.7% |
|
|
% Evening |
28.1% |
26.1% |
24.4% |
24.9% |
23.7% |
21.2% |
19.3% |
18.3% |
17.7% |
17.3% |
|
|
|
|
|
|
|
|
|
|
|
|
|
|
|
Due to rounding, the sum
of the numbers may not equal the Total. |
|
|
Last updated on |
May 15, 2018 |
|
|
Print in landscape for best results |
|
|
|
|
Source:
Official 45th Day FTSE numbers as reported by the colleges after
manual adjustments (unaudited). |
|
|
Maricopa Community College District • Office of
Institutional Effectiveness • Maricopa Trends |
|
|
https://asa.maricopa.edu/departments/institutional-effectiveness/data-and-projects/maricopa-trends |
|
|
|
|
|
|
|
|
|
|
|
|
|
|
|
|