|
|
|
|
|
|
|
|
|
|
|
|
|
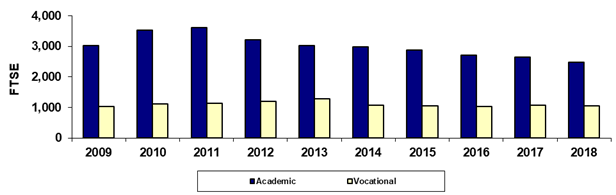
Paradise Valley Community College |
|
Spring 45th Day Academic/Vocational FTSE |
|
|
|
|
|
|
|
|
|
|
|
|
|
|
Year |
2009 |
2010 |
2011 |
2012 |
2013 |
2014 |
2015 |
2016 |
2017 |
2018 |
|
Academic |
3,020.3 |
3,520.2 |
3,608.0 |
3,219.5 |
3,024.0 |
2,975.5 |
2,874.1 |
2,710.6 |
2,657.1 |
2,481.1 |
|
Vocational |
1,029.0 |
1,121.8 |
1,142.4 |
1,205.0 |
1,278.7 |
1,068.5 |
1,046.4 |
1,031.4 |
1,065.6 |
1,053.3 |
|
Total |
4,049.3 |
4,642.0 |
4,750.4 |
4,424.5 |
4,302.7 |
4,044.0 |
3,920.6 |
3,742.0 |
3,722.8 |
3,534.4 |
|
|
|
|
|
|
|
|
|
|
|
|
|
% Academic |
74.6% |
75.8% |
76.0% |
72.8% |
70.3% |
73.6% |
73.3% |
72.4% |
71.4% |
70.2% |
|
% Vocational |
25.4% |
24.2% |
24.0% |
27.2% |
29.7% |
26.4% |
26.7% |
27.6% |
28.6% |
29.8% |
|
|
|
|
|
|
|
|
|
|
|
|
|
Due to rounding, the sum
of the numbers may not equal the Total. |
|
|
Last updated on |
May 15, 2018 |
|
Print in landscape for best results |
|
|
|
Source:
Official 45th Day FTSE numbers as reported by the colleges after
manual adjustments (unaudited). |
|
Maricopa Community College District • Office of
Institutional Effectiveness • Maricopa Trends |
|
https://asa.maricopa.edu/departments/institutional-effectiveness/data-and-projects/maricopa-trends |
|
|
|
|
|
|
|
|
|
|
|
|
|
|